This article presents the list of custom and preset widgets available to build team and athlete custom dashboards, and explains the best use of each one.
Custom widgets
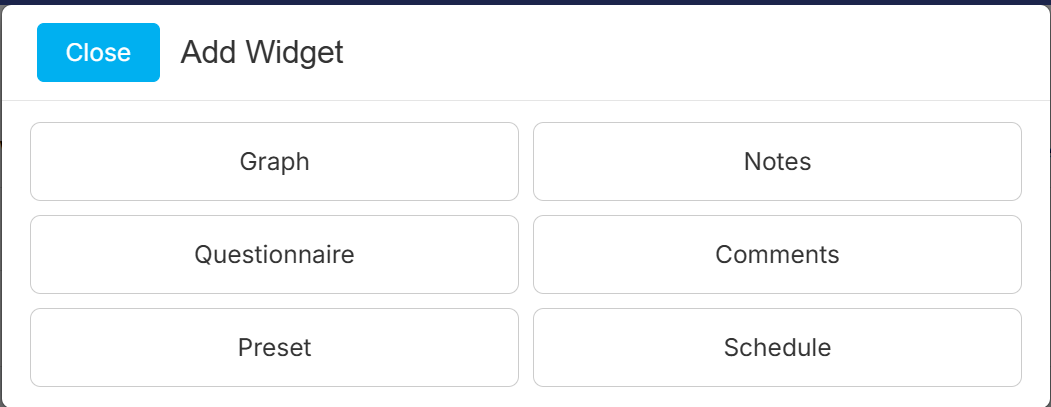
Graph widget
Use this widget to create data visualization graphs and multifactorial analyses combining data from one or multiple metrics, including assessment, wellness, workload, health and menstrual cycle data.
Data can be grouped by date, athlete, or a specific metric (in the case of scatter graphs).
Questionnaire widget
Use this widget to add questionnaire results, score, answers, completion status, etc. on team and individual dashboards
Notes widget
Use this widget to add a list of specific notes on team and individual dashboards
Comments widget
Use this widget to add a list of athlete and staff comments on team and individual dashboards
Schedule widget
Use this widget to add a list of past and future sessions and appointments for the users of your choice, including you.
Preset widgets
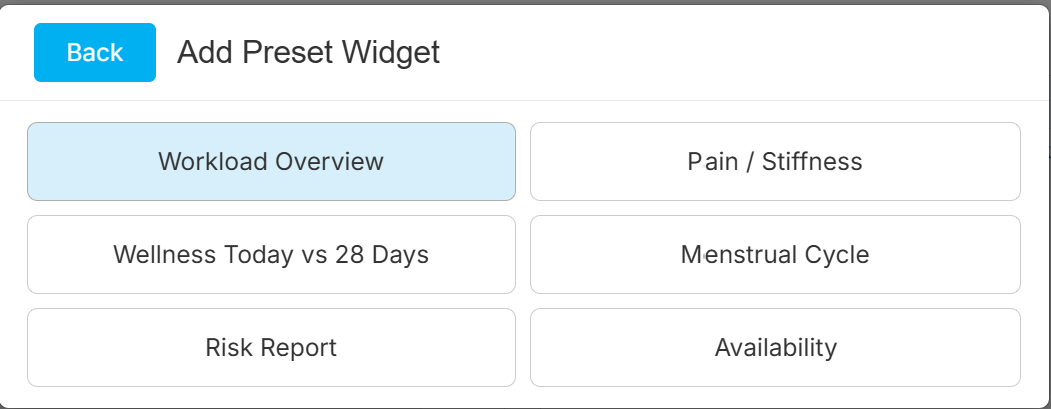
Workload overview
This widget displays a graph combining acute load, chronic load, acute:chronic workload ratios for any metric, daily sRPE loads per activity, health problems, assessment and competitions for the selected period
Availability
This widget displays a list of all available, partially available and unavailable athletes, based on their health status.
Risk Report
This widget displays a list of high, medium and low risk athletes, along with their individual risk score and risk factors.
Pain / stiffness
This widget displays an individual graph showing athlete-reported unusual pain and stiffness for the selected period
Wellness Today vs 28d
This widget displays an individual graph comparing today’s wellness scores for each wellness category, to the last 28d average.
Menstrual cycle
This widget displays an individual graph showing the different menstrual phases and symptoms for the selected athlete for the selected period
Was this article helpful?
That’s Great!
Thank you for your feedback
Sorry! We couldn't be helpful
Thank you for your feedback
Feedback sent
We appreciate your effort and will try to fix the article