Once wellness data is recorded, you can easily analyze it and detect athletes with wellness issues. AthleteMonitoring offers multiple ways to analyze data.
Custom dashboard
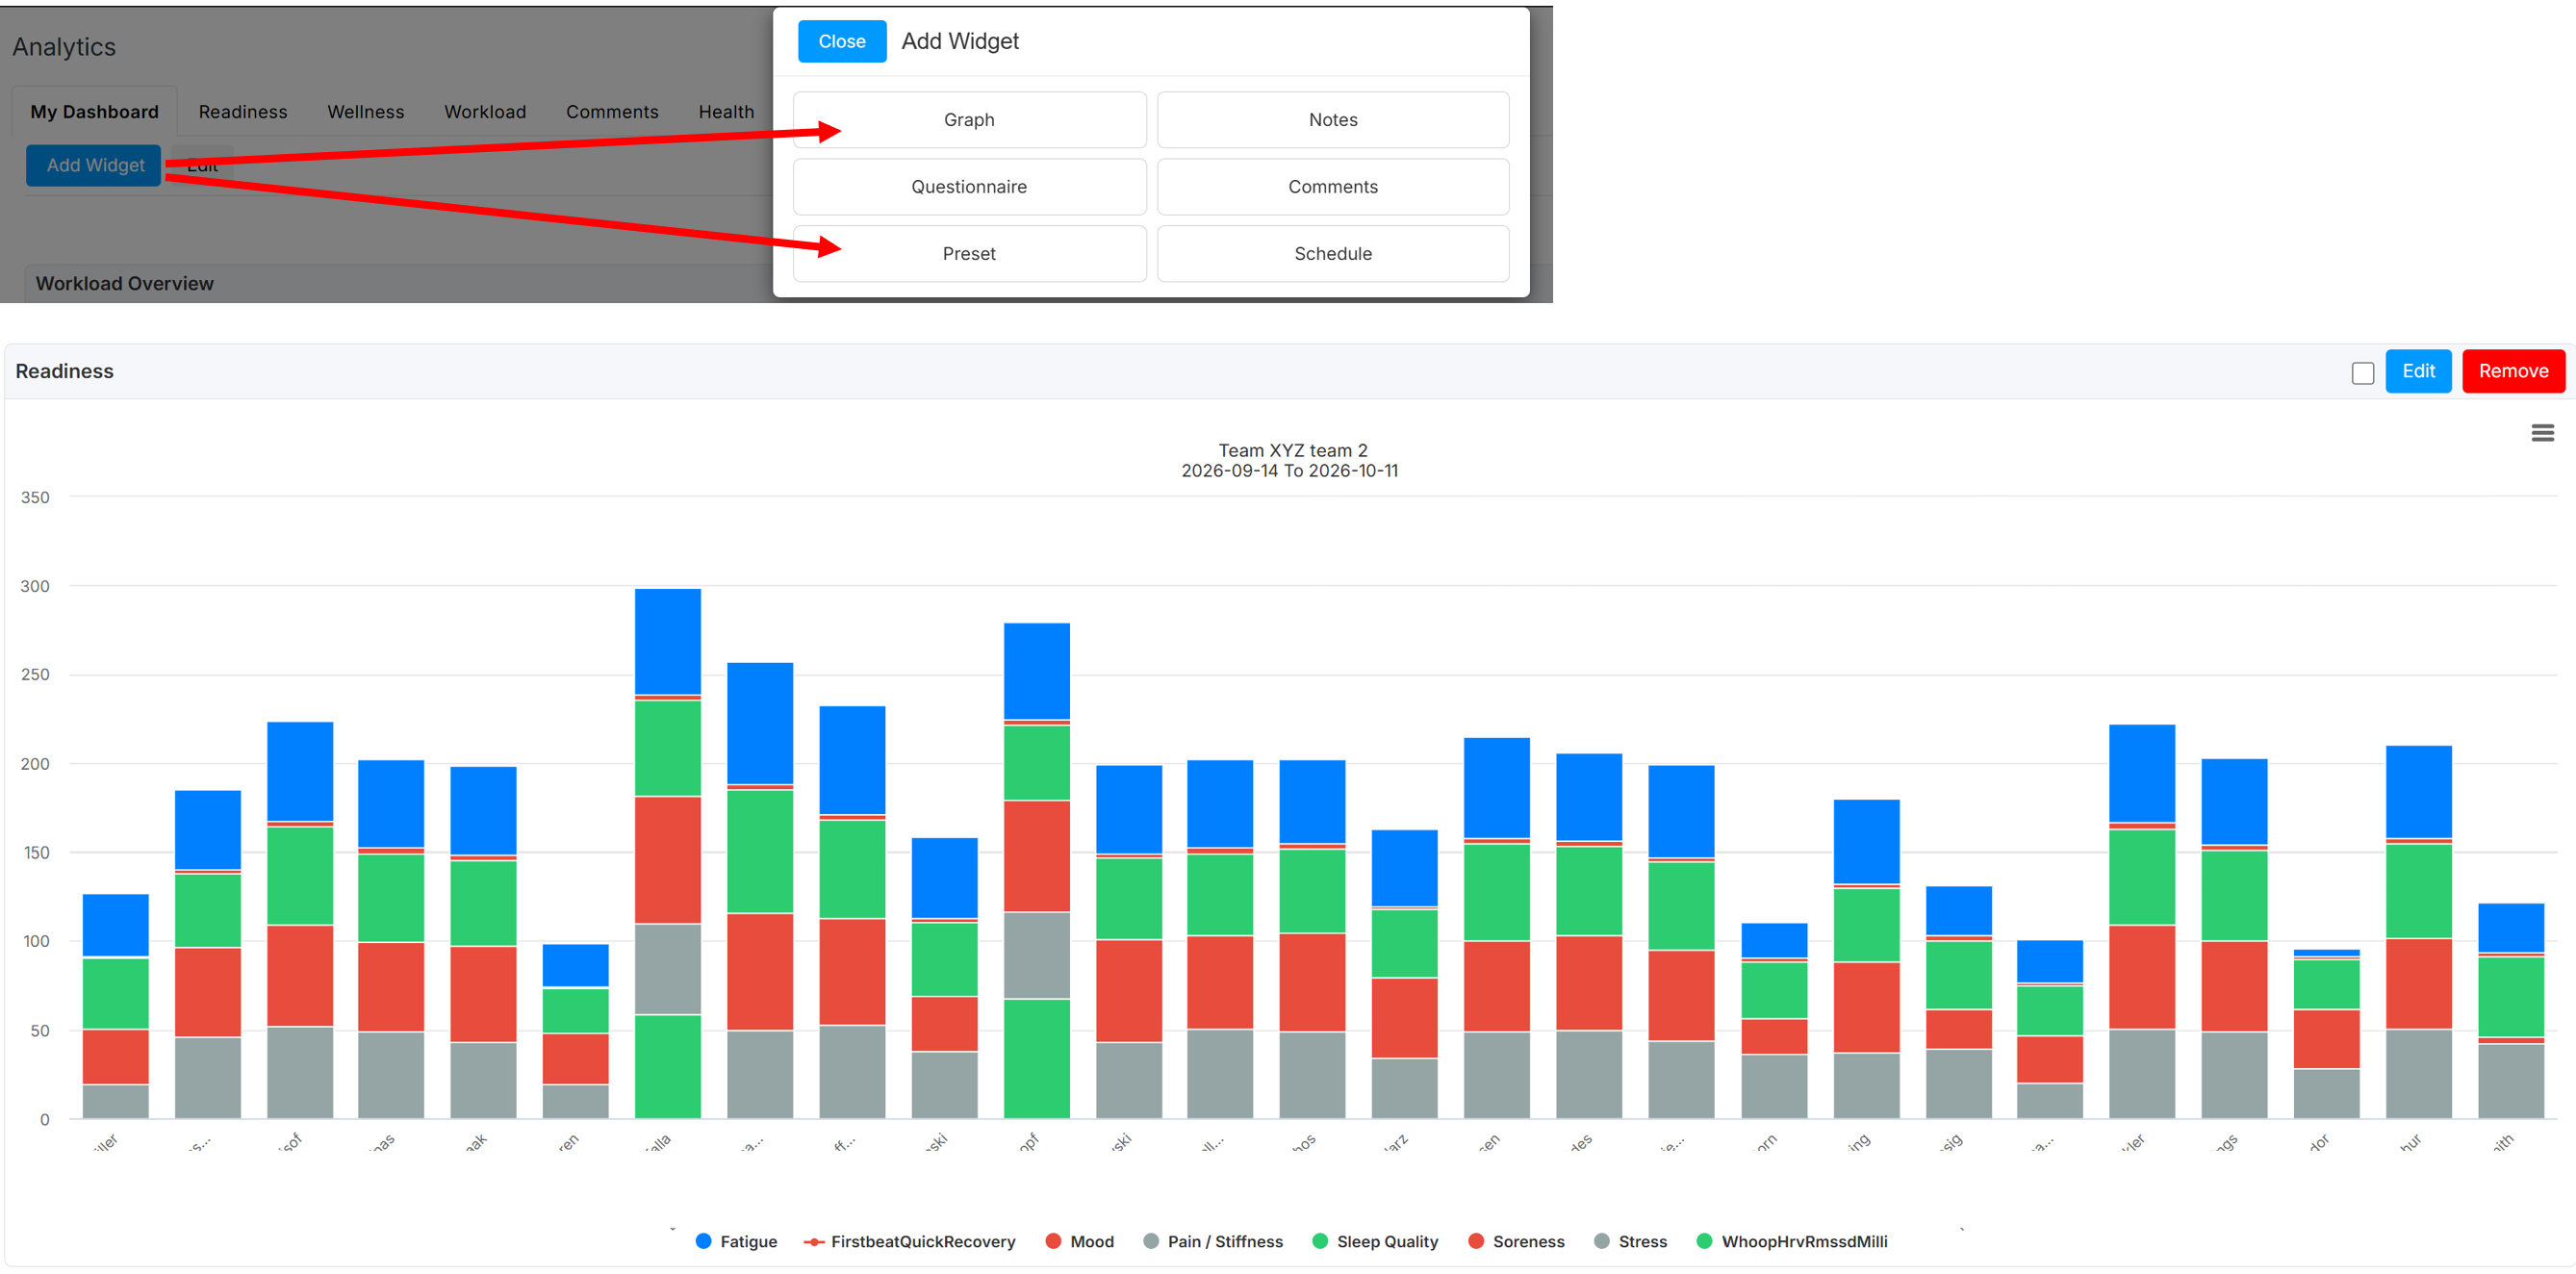
To add wellness graphs and analyzes on your custom dashboard, open the My Dashboard tab, click Add widget and select either the graph (will allow you to create your own graphs) or the Preset option (will include pre-built views such as risk and z-scores, menstrual cycle graphs, etc.)
Readiness dashboard
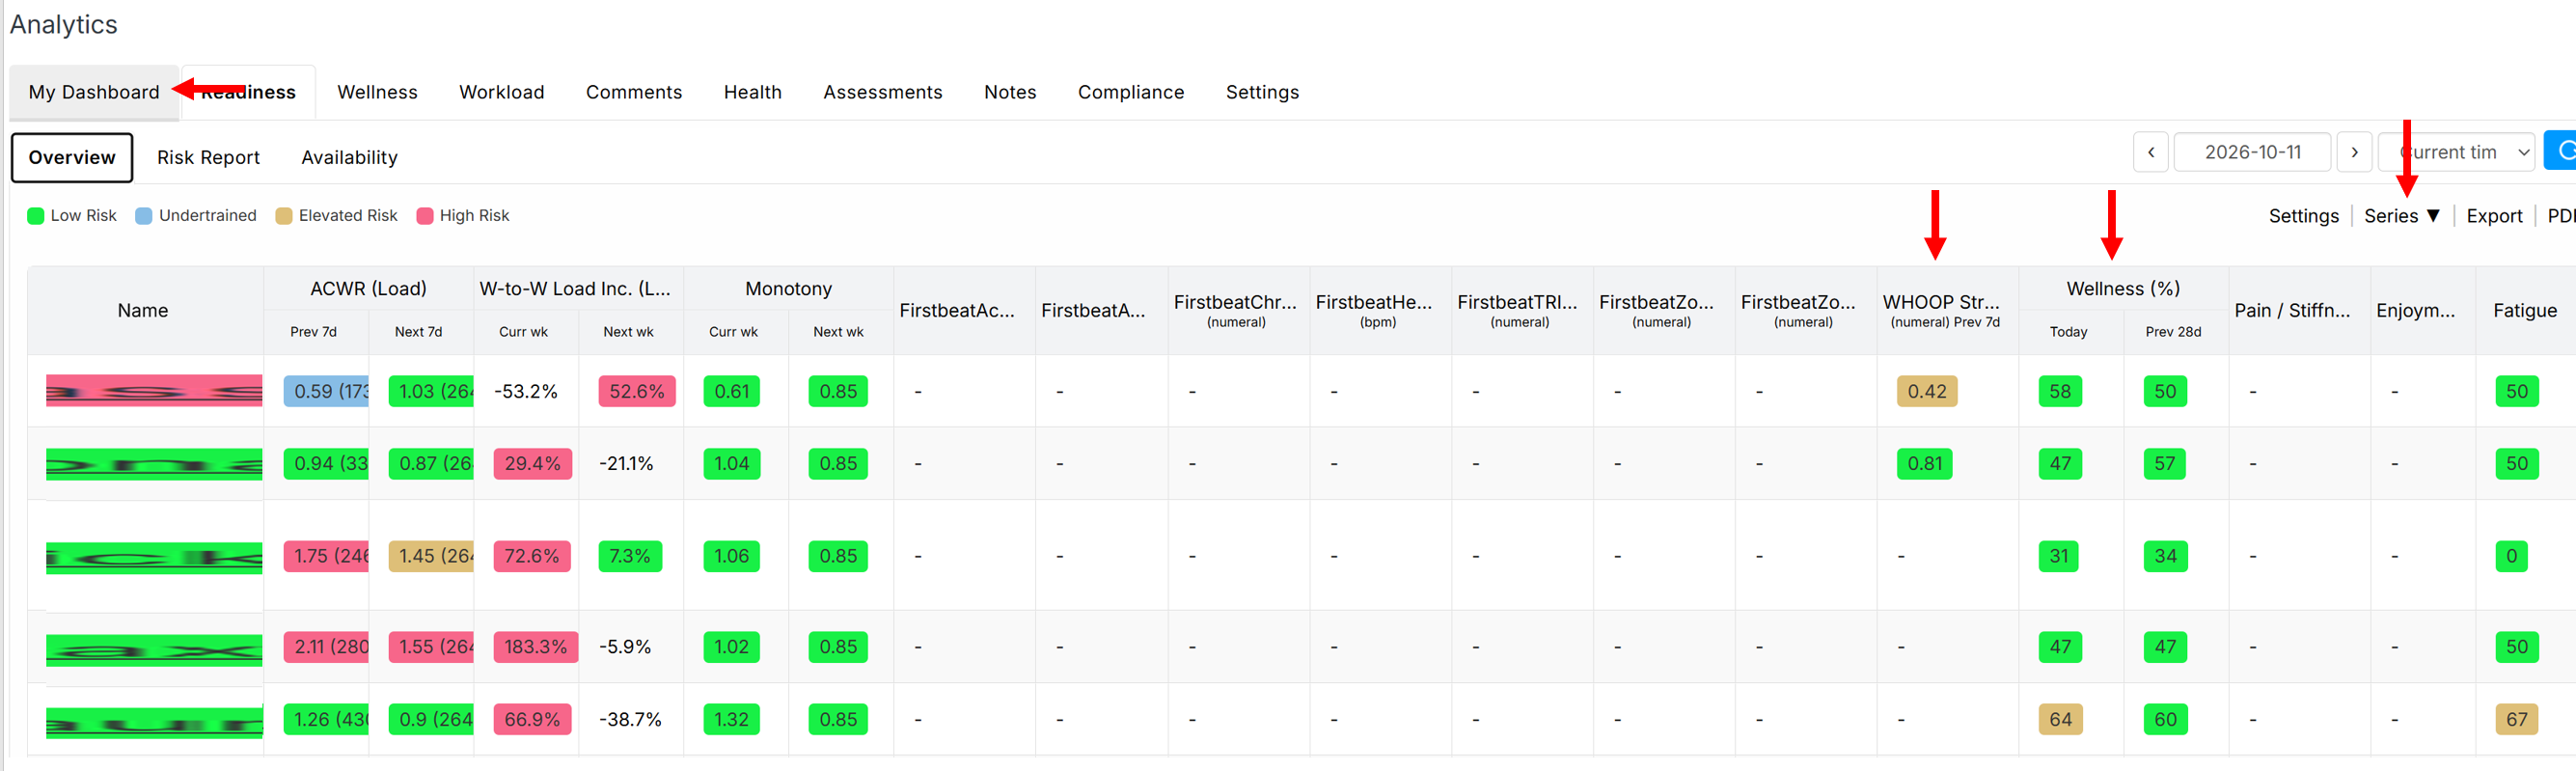
To assess wellness-related risk in regard of workload, health or assessment metrics, open the Readiness - Overview tab. To temporarily remove columns from the dashboard, select Series. To permanently remove columns, or adjust risk calculations and alert system, click Settings.
To learn more about how AthleteMonitoring calculates risk, please refer to this article.
To learn more about customizing the alert and recommendation system, please refer to this article.
Wellness dashboard
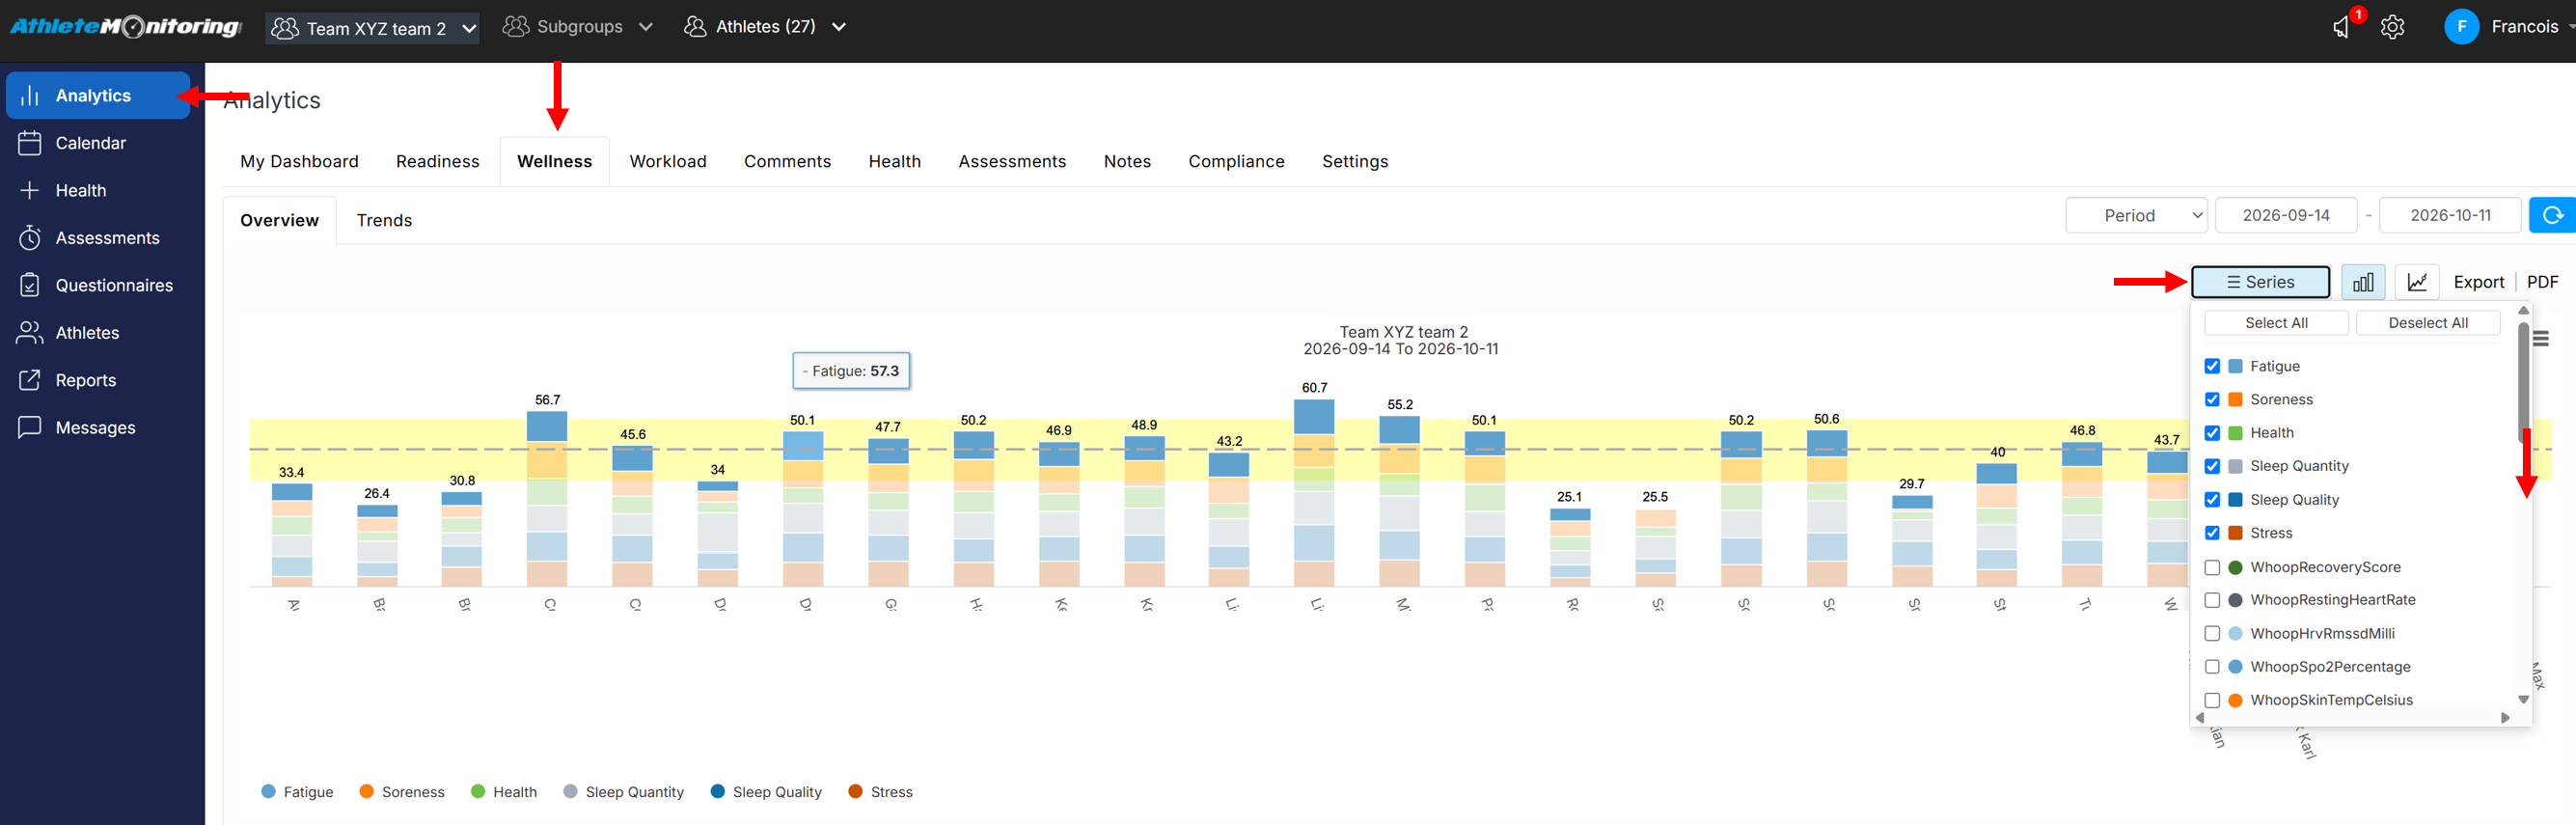
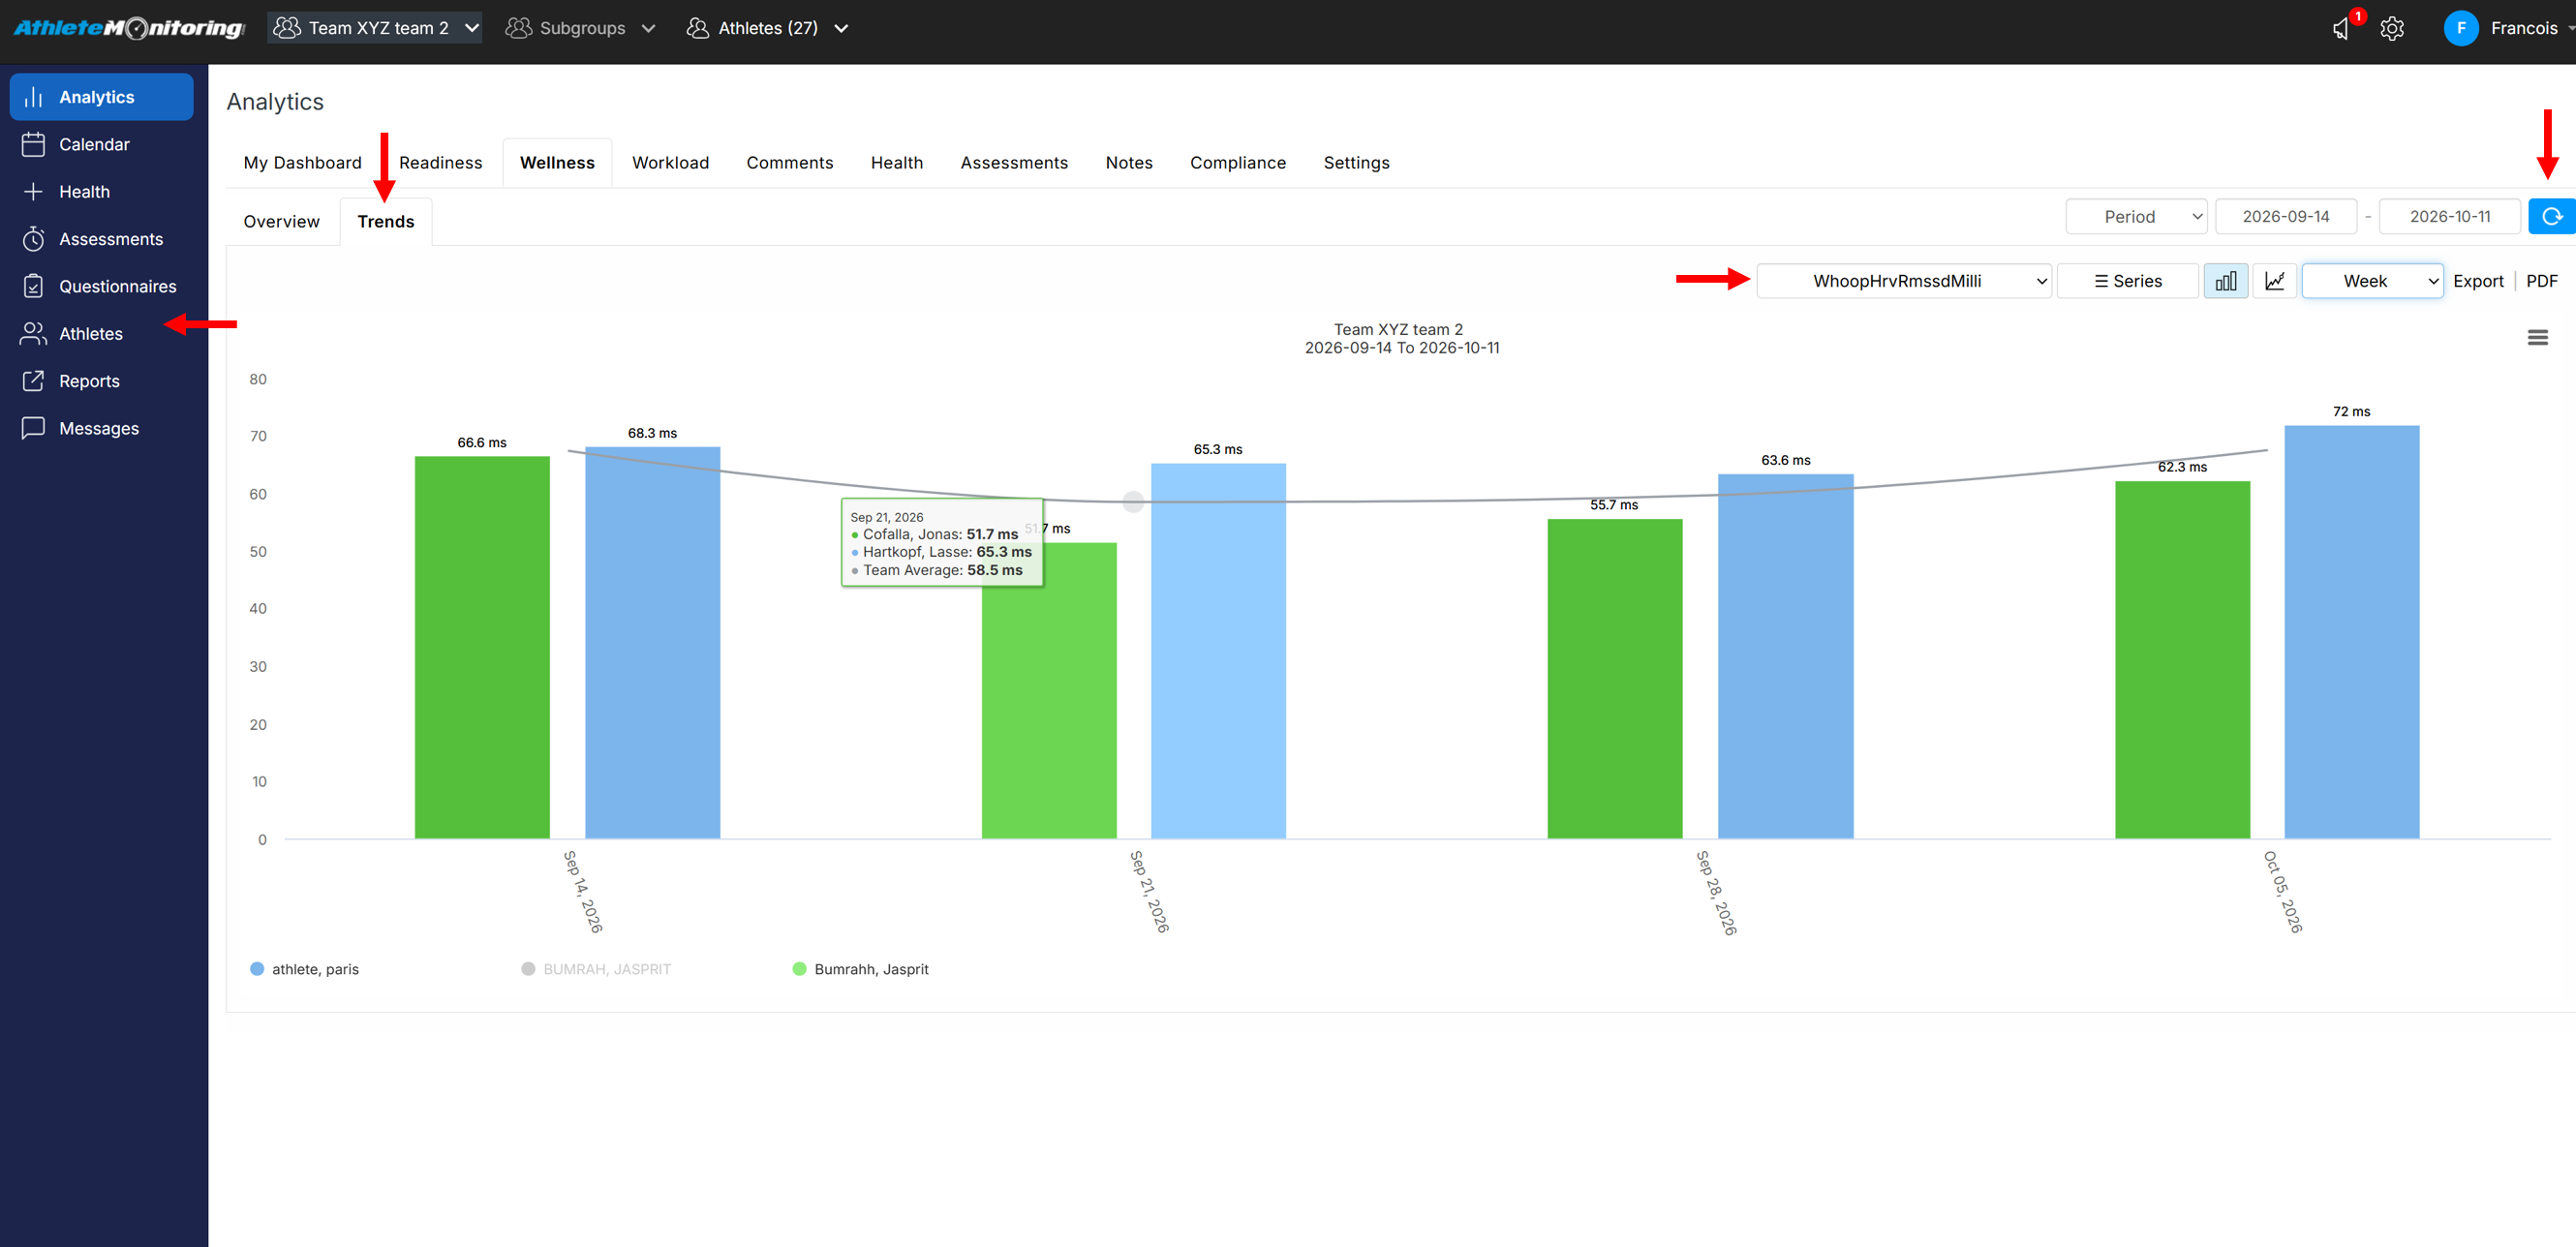
To generate wellness reports and graphs for the selected team(s) and athlete(s), open Analytics-Wellness section, select a date range and click Refresh. To add/remove metrics from the graph, click Series and select the desired options.
To analyze trends, open Analytics-Trends tab and select the desired options.
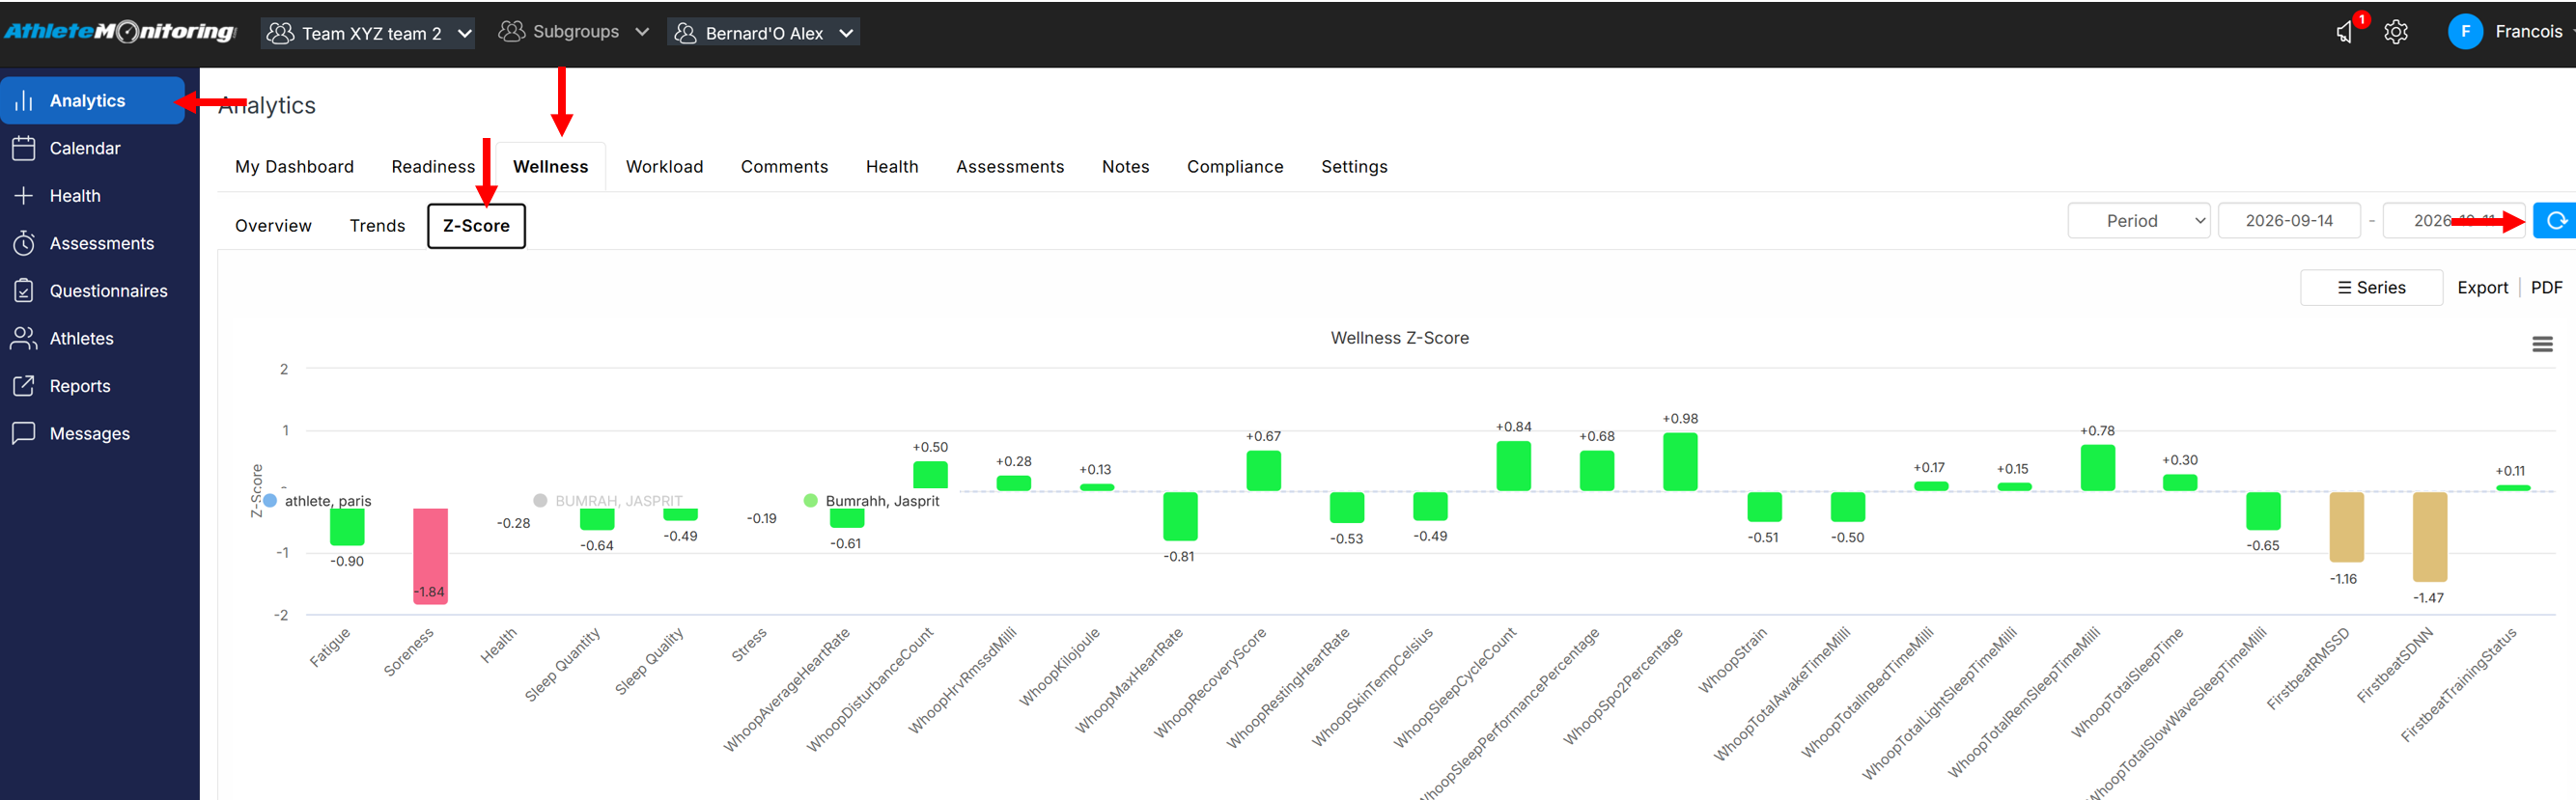
To analyze z-scores, select a single athlete in the top selector, and open the z-score tab