You can easily display such a graph by selecting one athlete, and opening the Wellness and Z-Score tabs. When custom fields are defined in the Wellness questionnaire section, and data is available, a daily z-score graph will be automatically displayed.
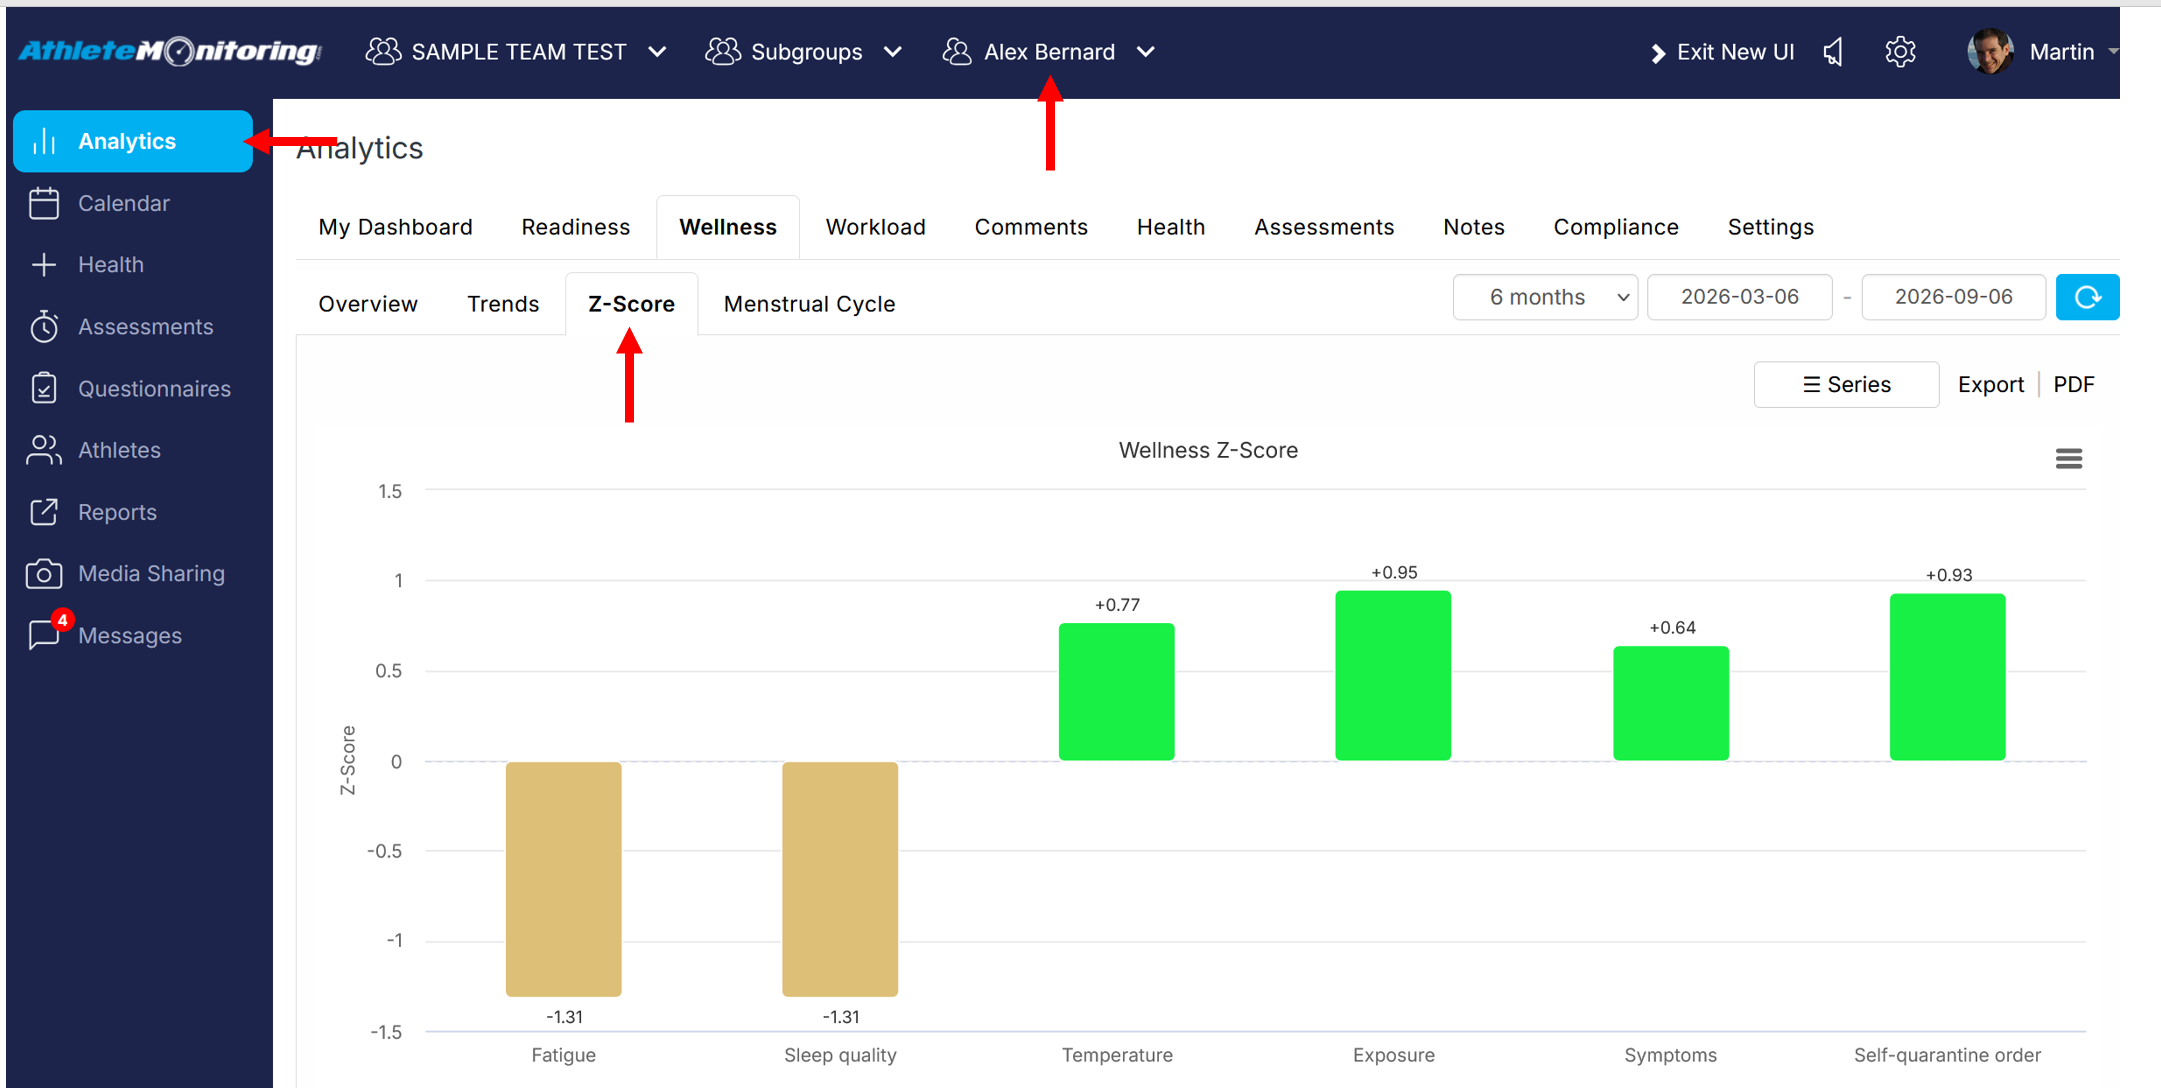
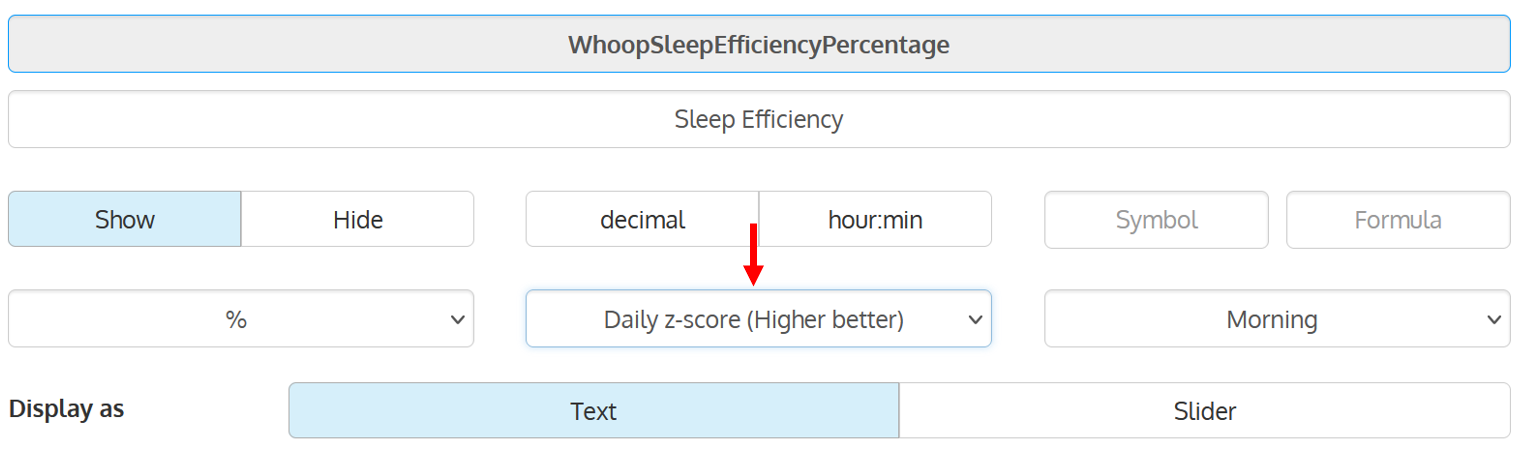
Z-score bar colours are automatically assigned, according to each wellness measure's alert settings defined in team settings.
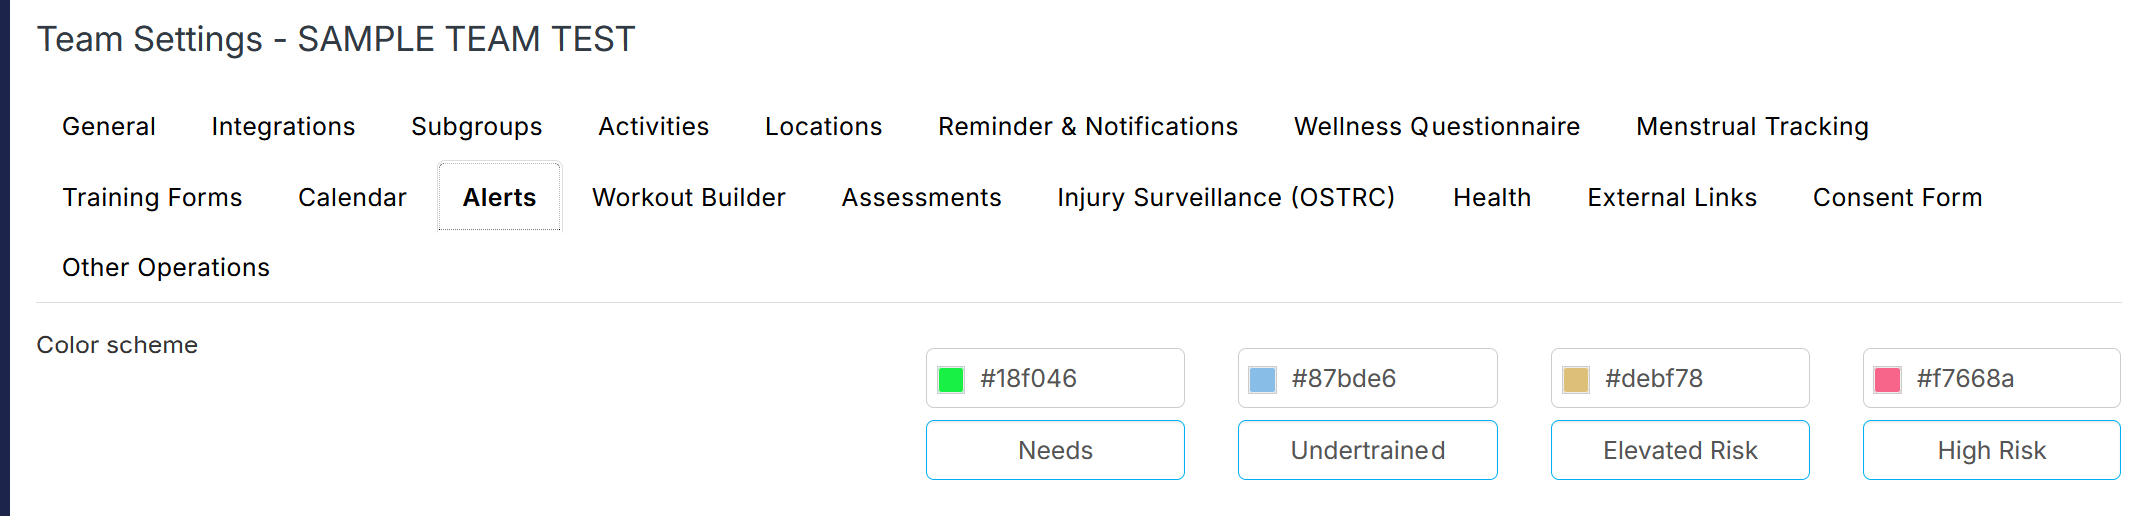
Colours can be modified in Team Settings-Alerts-Color Scheme.
Was this article helpful?
That’s Great!
Thank you for your feedback
Sorry! We couldn't be helpful
Thank you for your feedback
Feedback sent
We appreciate your effort and will try to fix the article