Open the health history dashboard and click the small graph icon.
The graph shows both the number of missed days each week and the severity of each health problem for the period of your choice (default 12 months).
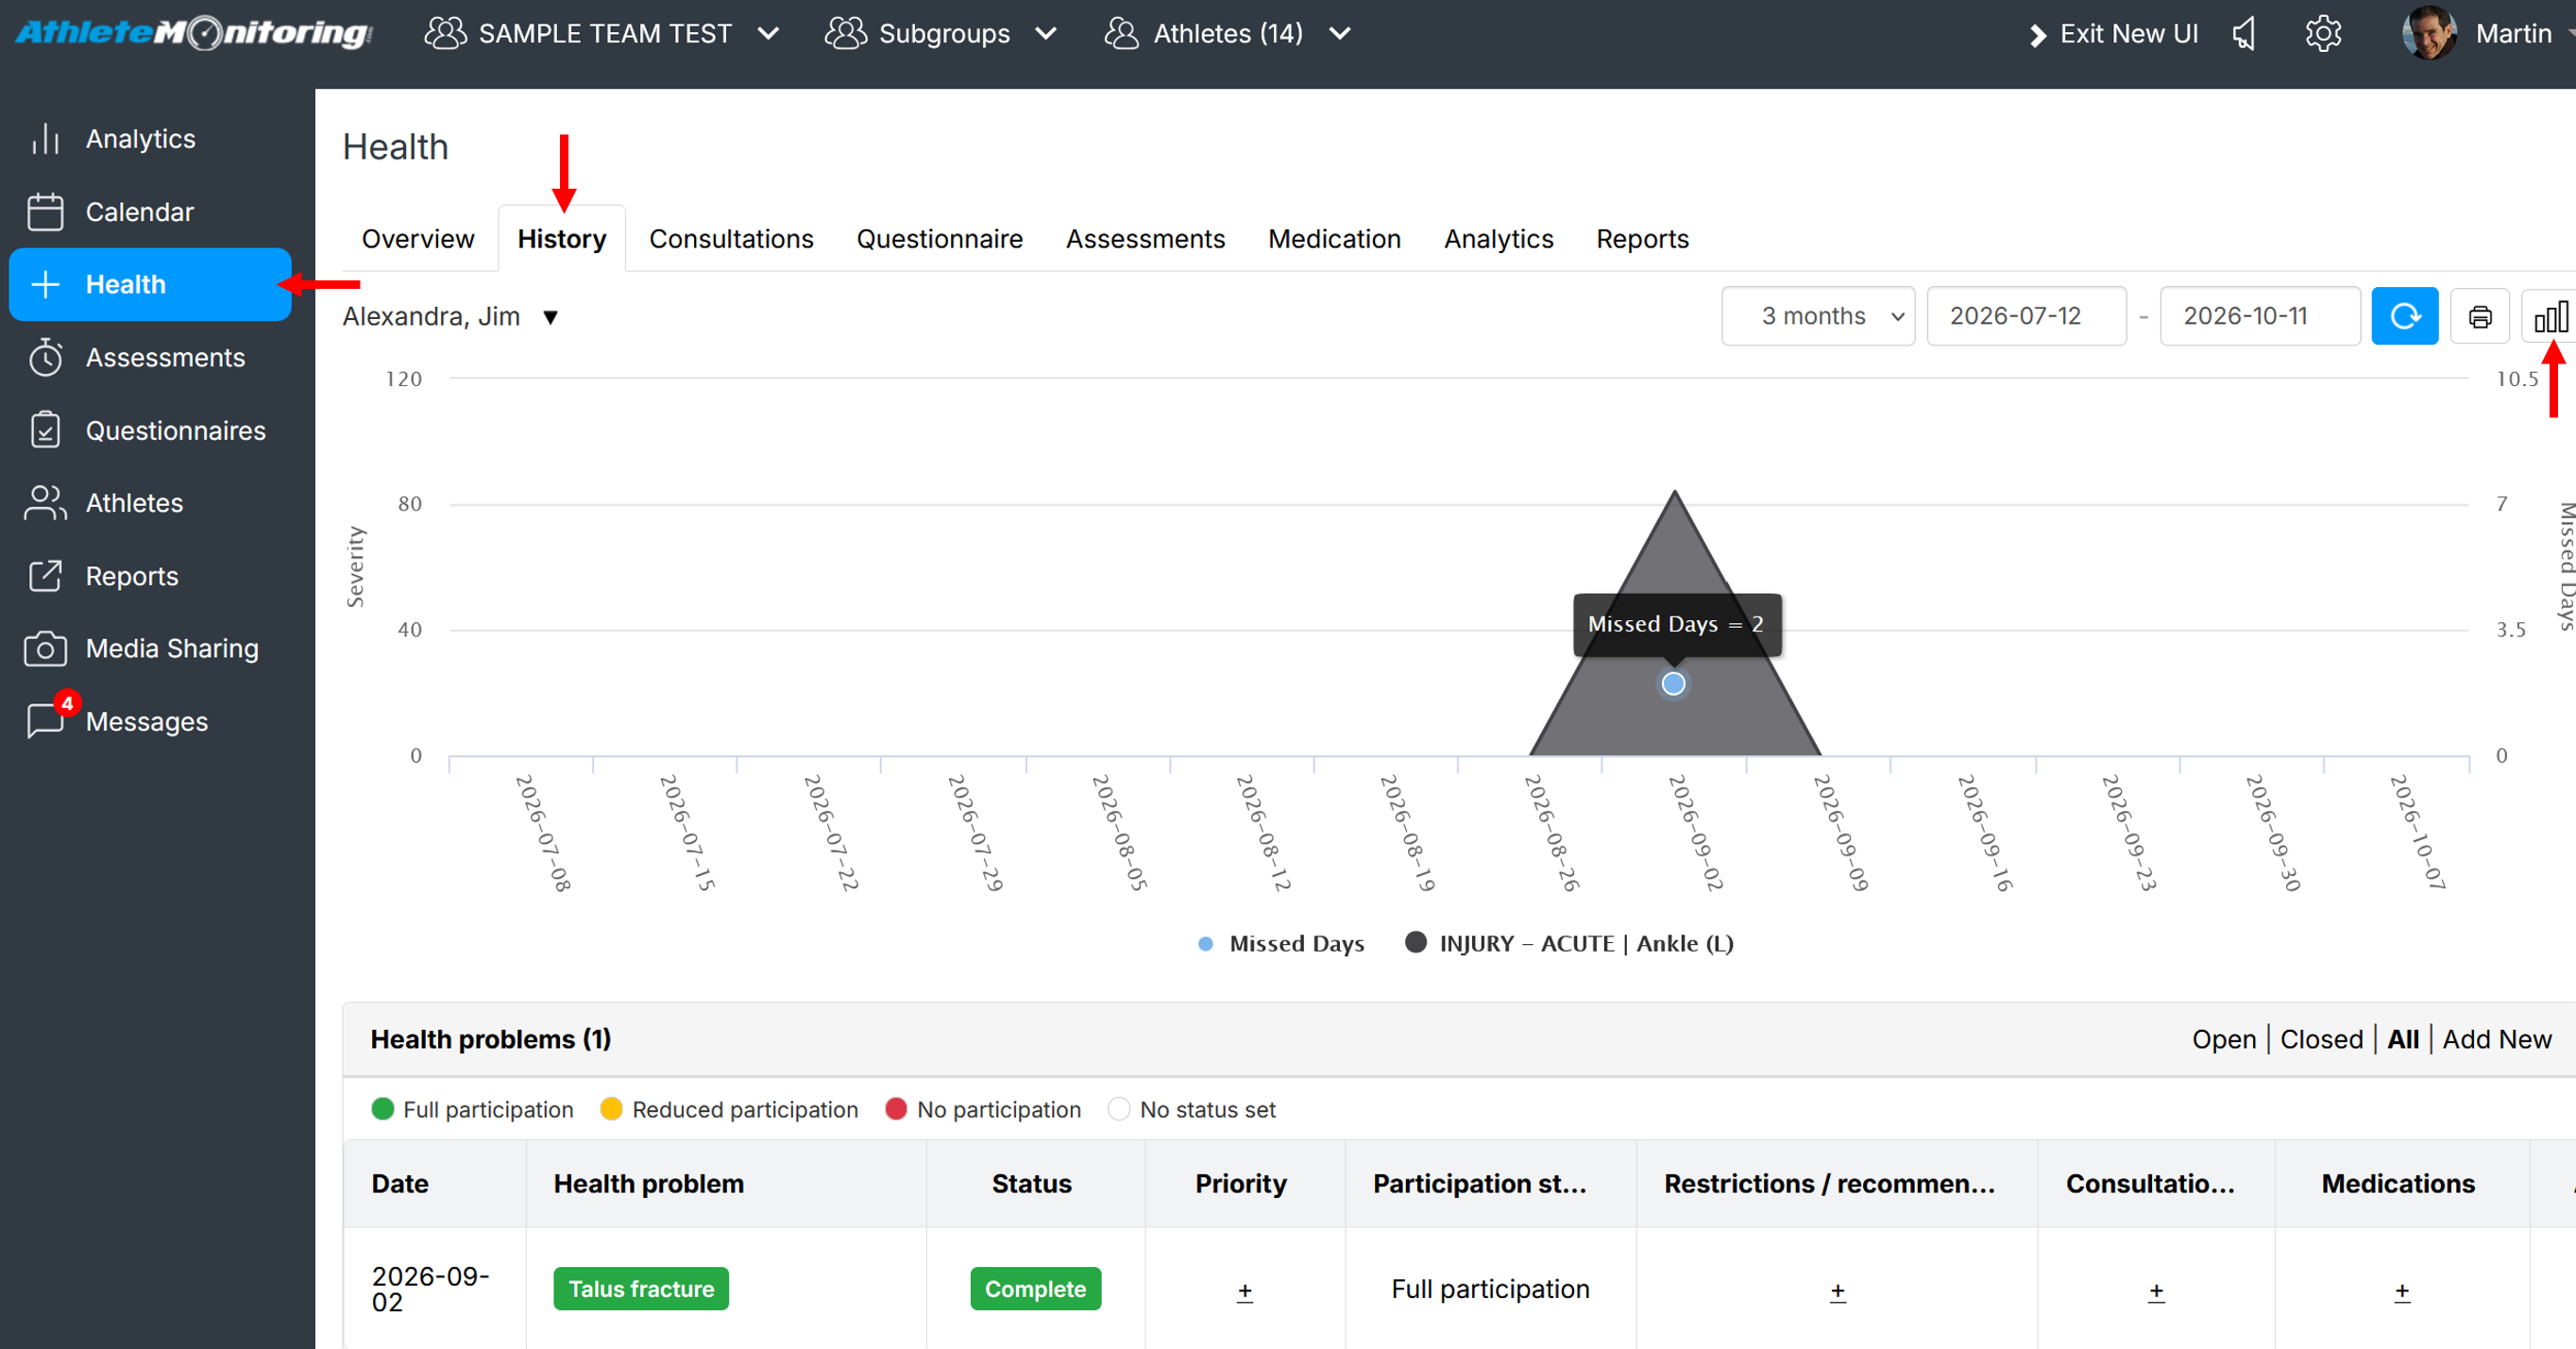
You can show/hide incidents by clicking on their respective names under the graph.
Was this article helpful?
That’s Great!
Thank you for your feedback
Sorry! We couldn't be helpful
Thank you for your feedback
Feedback sent
We appreciate your effort and will try to fix the article