
AthleteMonitoring workload management graphs are great ways to visualize and compare all important workload management metrics on a single graph.
To view such graphs, click Analytics - Workload - Overview, select a date range or a preset period and click Refresh.
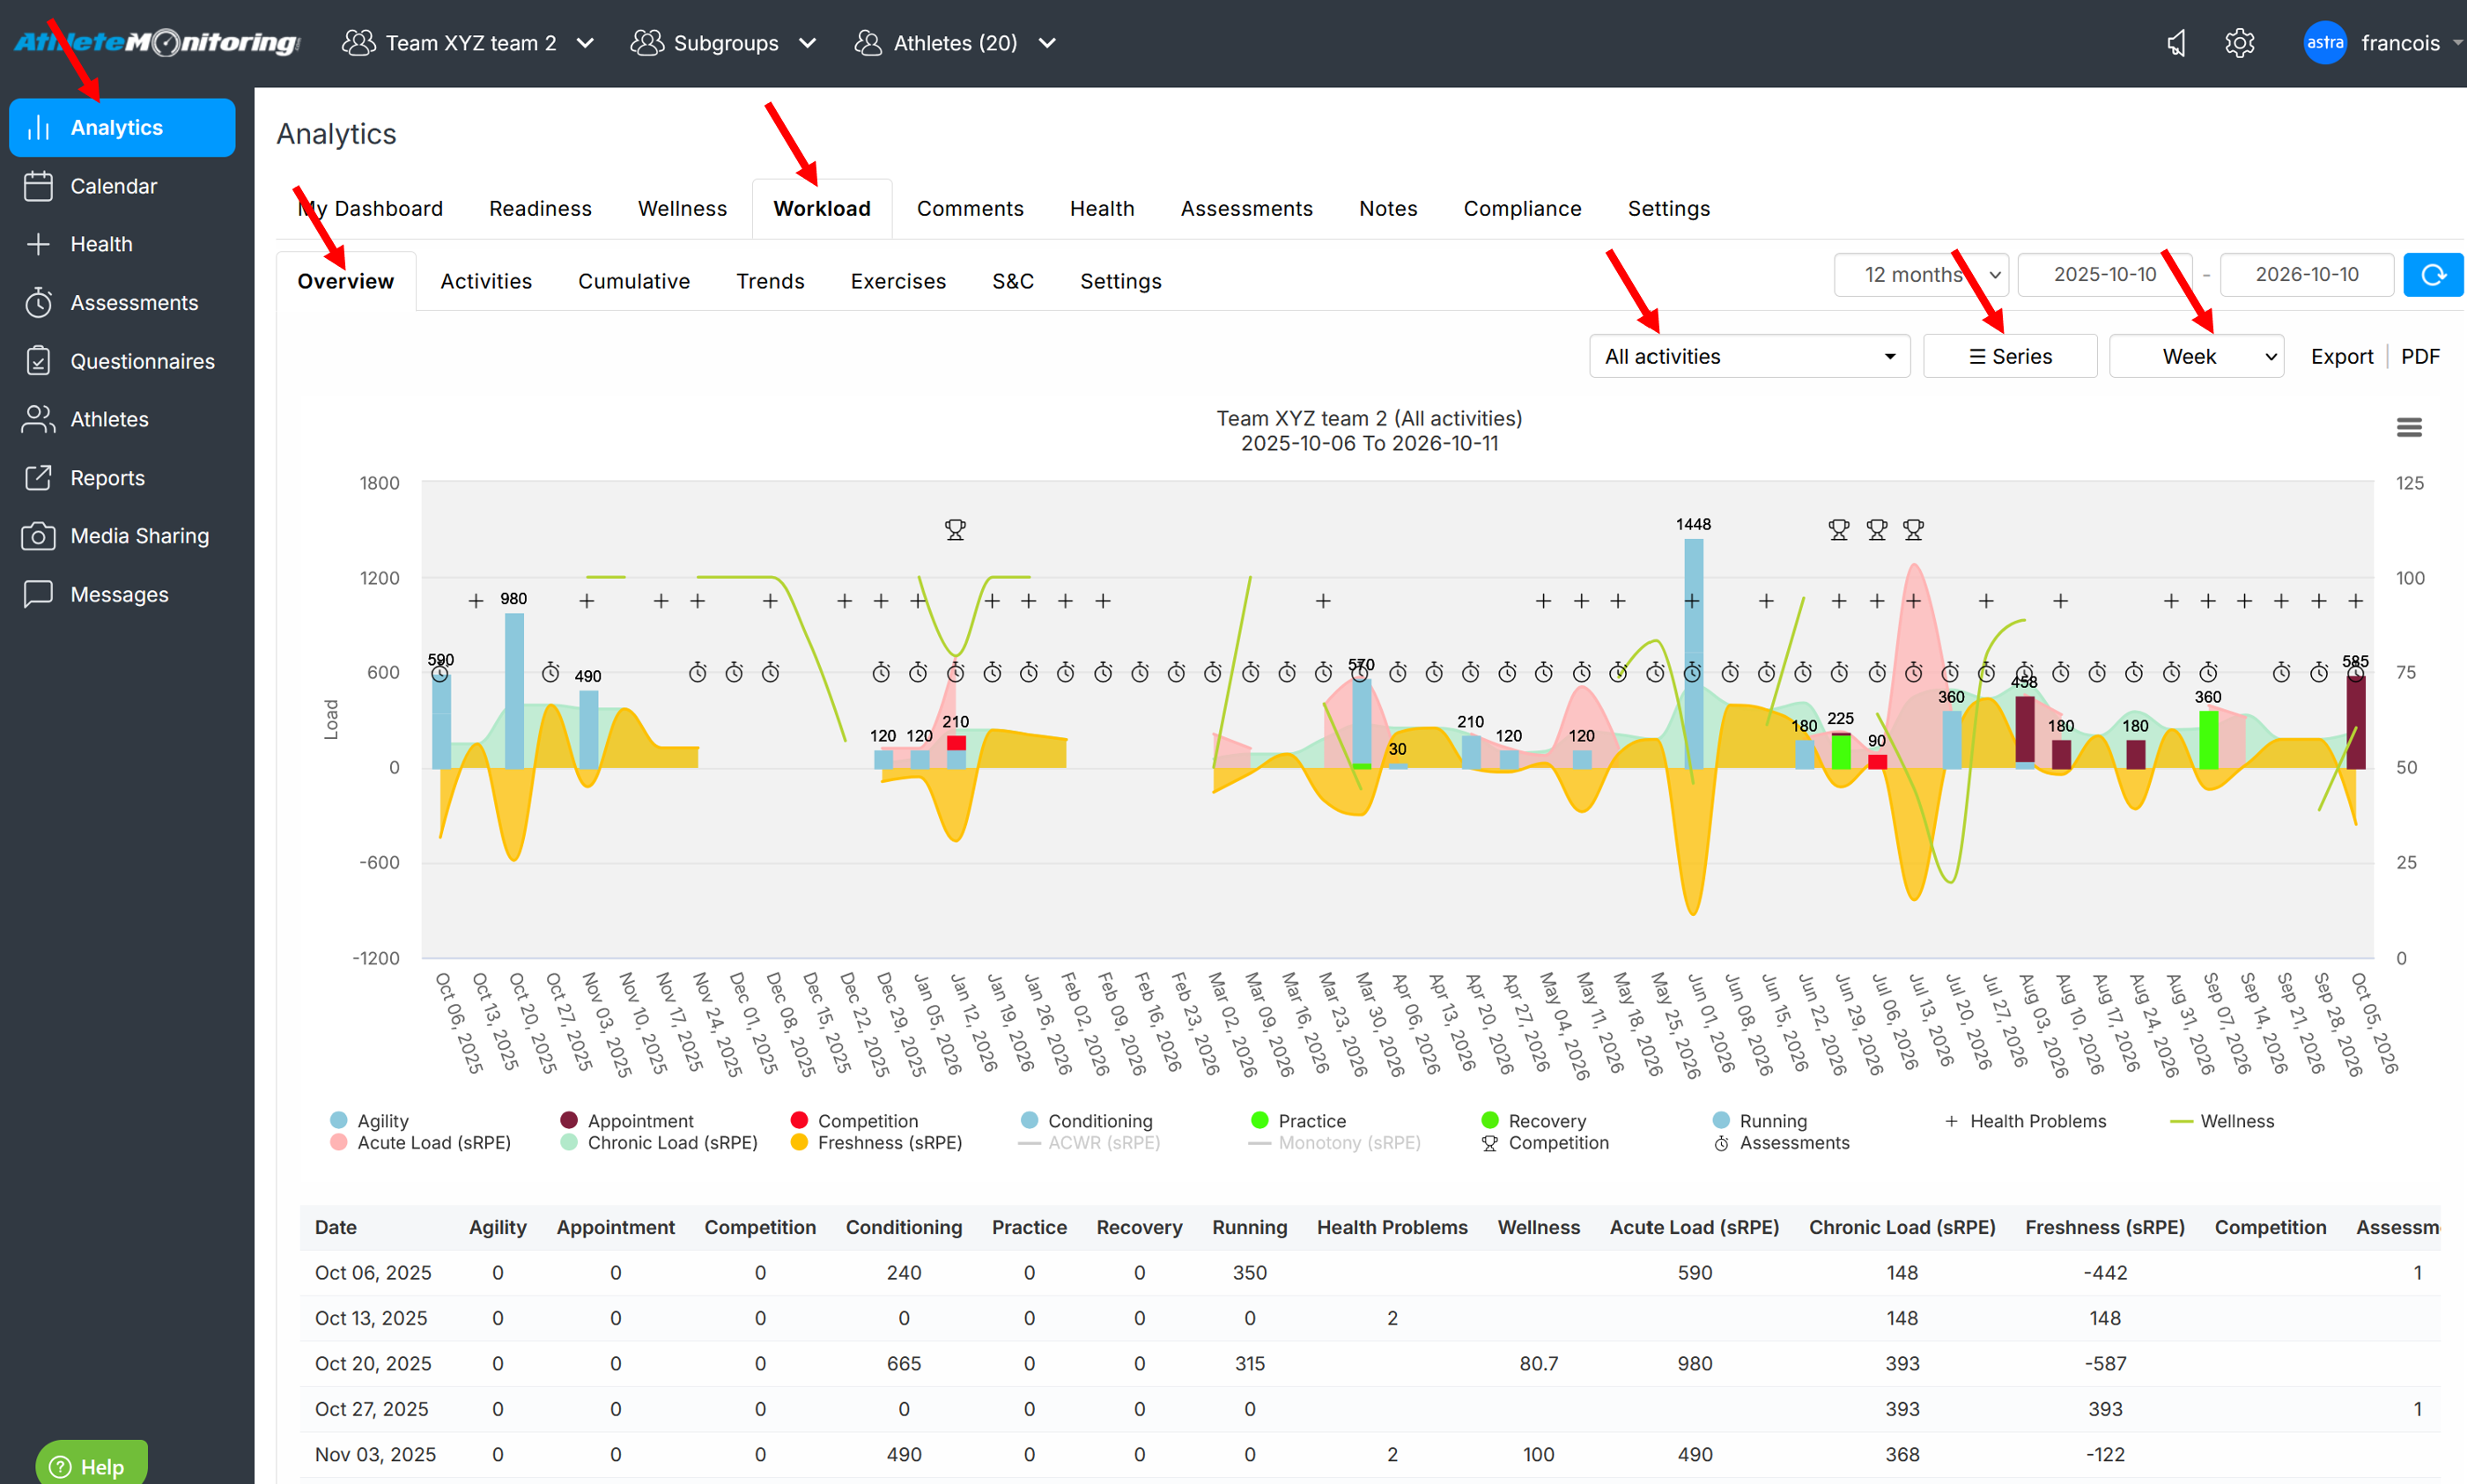
To display daily, weekly or monthly data, select the data grouping button next to the Export link.
To display data for a specific activity, select the activity in the corresponding list.
To add/remove metrics from the graph, select Series and select/deselect values.
To temporarily hide metrics from the graph, click on the metric's name under the graph.
Planned competitions and assessments are represented by respectively a trophy and a stopwatch.
Example 1
Team daily load for each activity, planned load, injuries, acute and chronic load, acute:chronic workload ratio (ACWR), freshness and monotony for 21 days. Daily Wellness score has been removed from the graph.

Example 2
Individual daily, acute and chronic load and ACWR, during a 2.5 month period

Example 3
Individual weekly total for each activity during a 2.5 month period

Example 4
Team acute:chronic workload ratio, chronic and acute load and freshness index

The workload management metrics
Chronic Load (CL)
This is the average weekly load (Load=duration x sRPE), typically over the previous 4 weeks. Usually, the higher the chronic load, the fitter the athlete. In some situations, chronic load can also be calculated using exponentially weighted average, and for periods longer than 4 weeks.
Acute Load (AL)
The Acute Load represents the cumulative load of the current week. Usually, the higher the acute load (compared to chronic load), the more tired is the athlete. In some situations, AL can also be calculated using shorter periods (eg: 3 days).
Figure 5 – Daily, acute and chronic load and ACWR visualized over a 2-months period. ©AthleteMonitoring.com
Acute:Chronic Workload Ratio (ACWR)
The ACWR measures the relationship between acute load (current week load) and chronic load (last 4-weeks average load) for the selected metrics. Monitoring ACWR helps to keep player’s load in the ‘high-load, low-risk zone’ (0.8-1.3). When ACWR is too low (less than 0.8) or too high (1.5 or more), risk increases and workload must be adjusted.
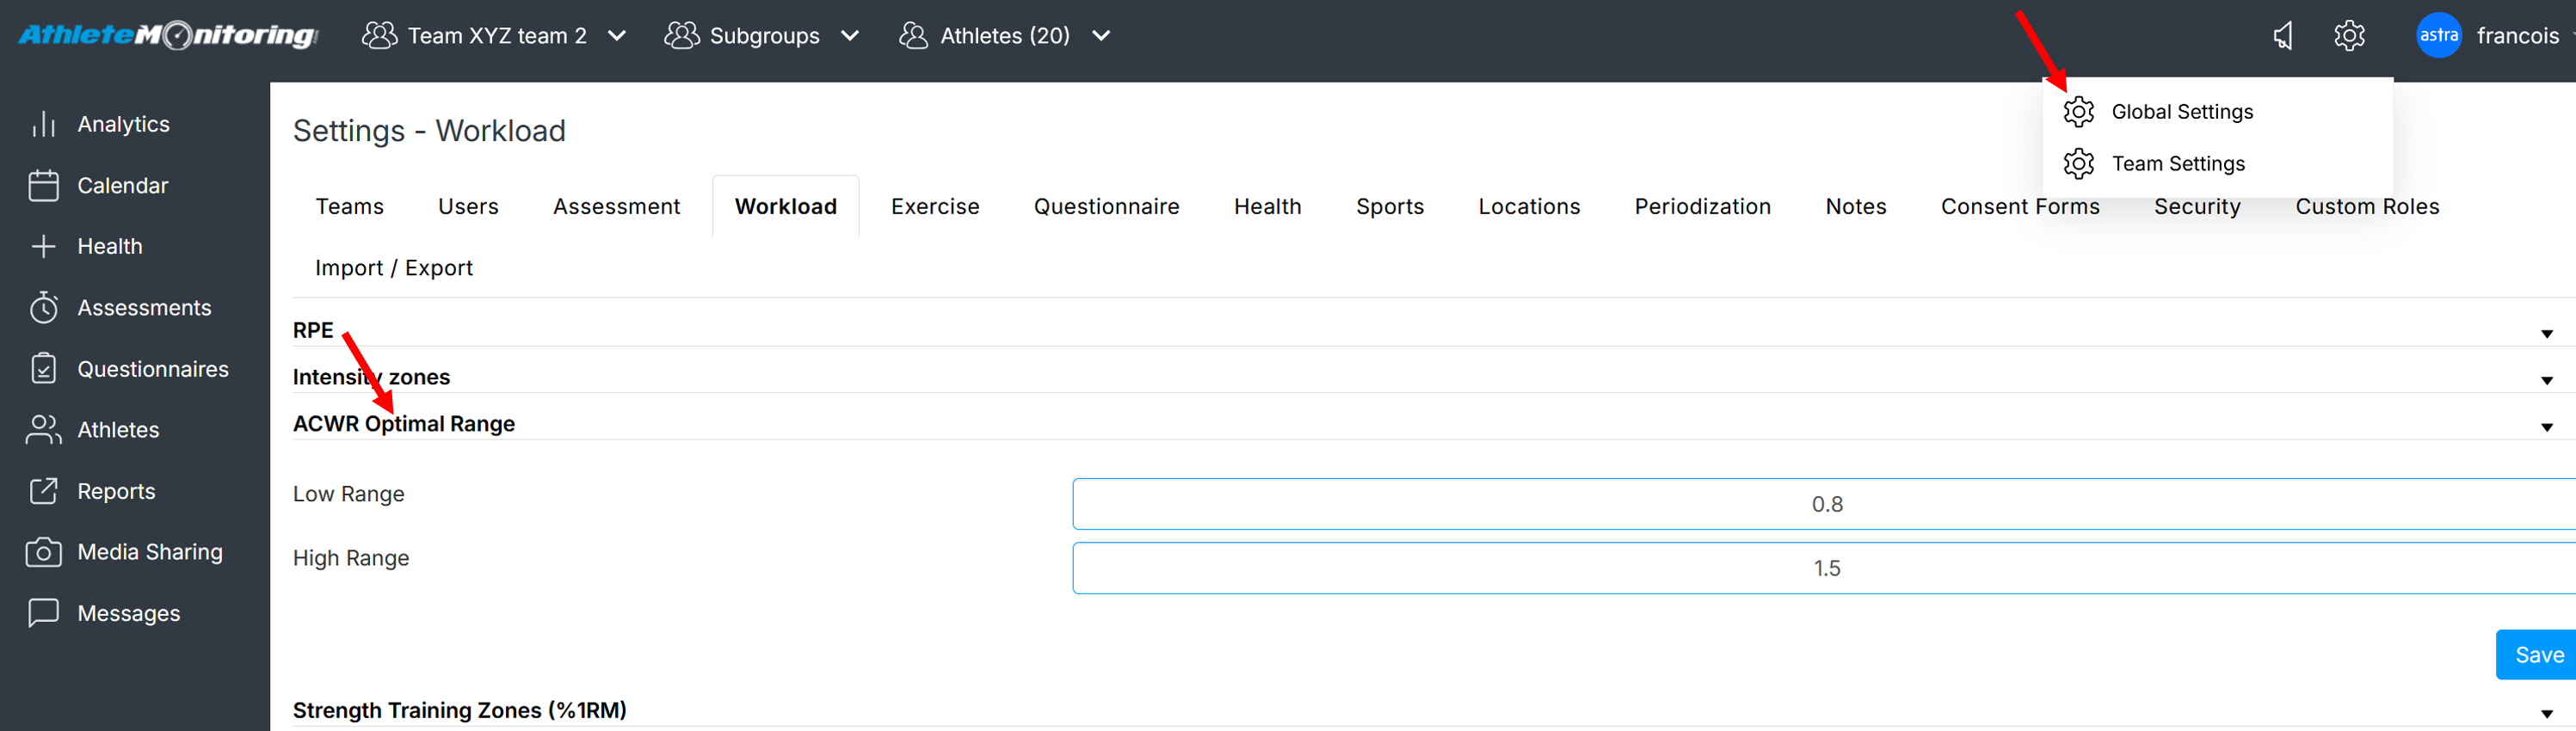
Individual Acute:Chronic Workload Ratio (ACWR) calculations can be selected in team settings - training forms. The alert threshold for ACWR can be modified in Global settings-Workload-ACWR optimal range.
Freshness Index (FI)
This is the difference between chronic and acute load (CL-AL) or between ‘fitness’ and ‘fatigue’. A positive Freshness Index indicates an unloading phase where low fatigue and good performance levels are to be expected.
Weekly Load Increase
This is the percentage of load increase from one week to the next. Studies shows that up to 40 % of injuries are associated with a rapid change in load from the preceding week and that when load increase of 15 % from the preceding week, the risk of injury jumps by up to almost 50 %. Monitoring week-to-week changes in load helps detecting such spikes in load and plays a crucial role in injury prevention.
Monotony
The Monotony Index (mean daily load/standard deviation of weekly load) detects when daily loads are not fluctuating enough within the week. A Monotony Index above 2 is an important risk factor for illness and overtraining. When this happens, modify your program to ensure that hard and easy days are alternating within the week. If athlete reports more than 3 ‘hard’ days per week, make sure to add an extra 1-2 easy or rest day.