The Analytics menu gives you access to fast and powerful data visualization and analytics tools. It includes a fully customizable dashboard section -the My Dashboard tab - and 8 thematic tabs that presents data in a series of curated albeit highly configurable graphs, tables and reports.
My Dashboard
This section displays your user-specific widget-based custom dashboard.
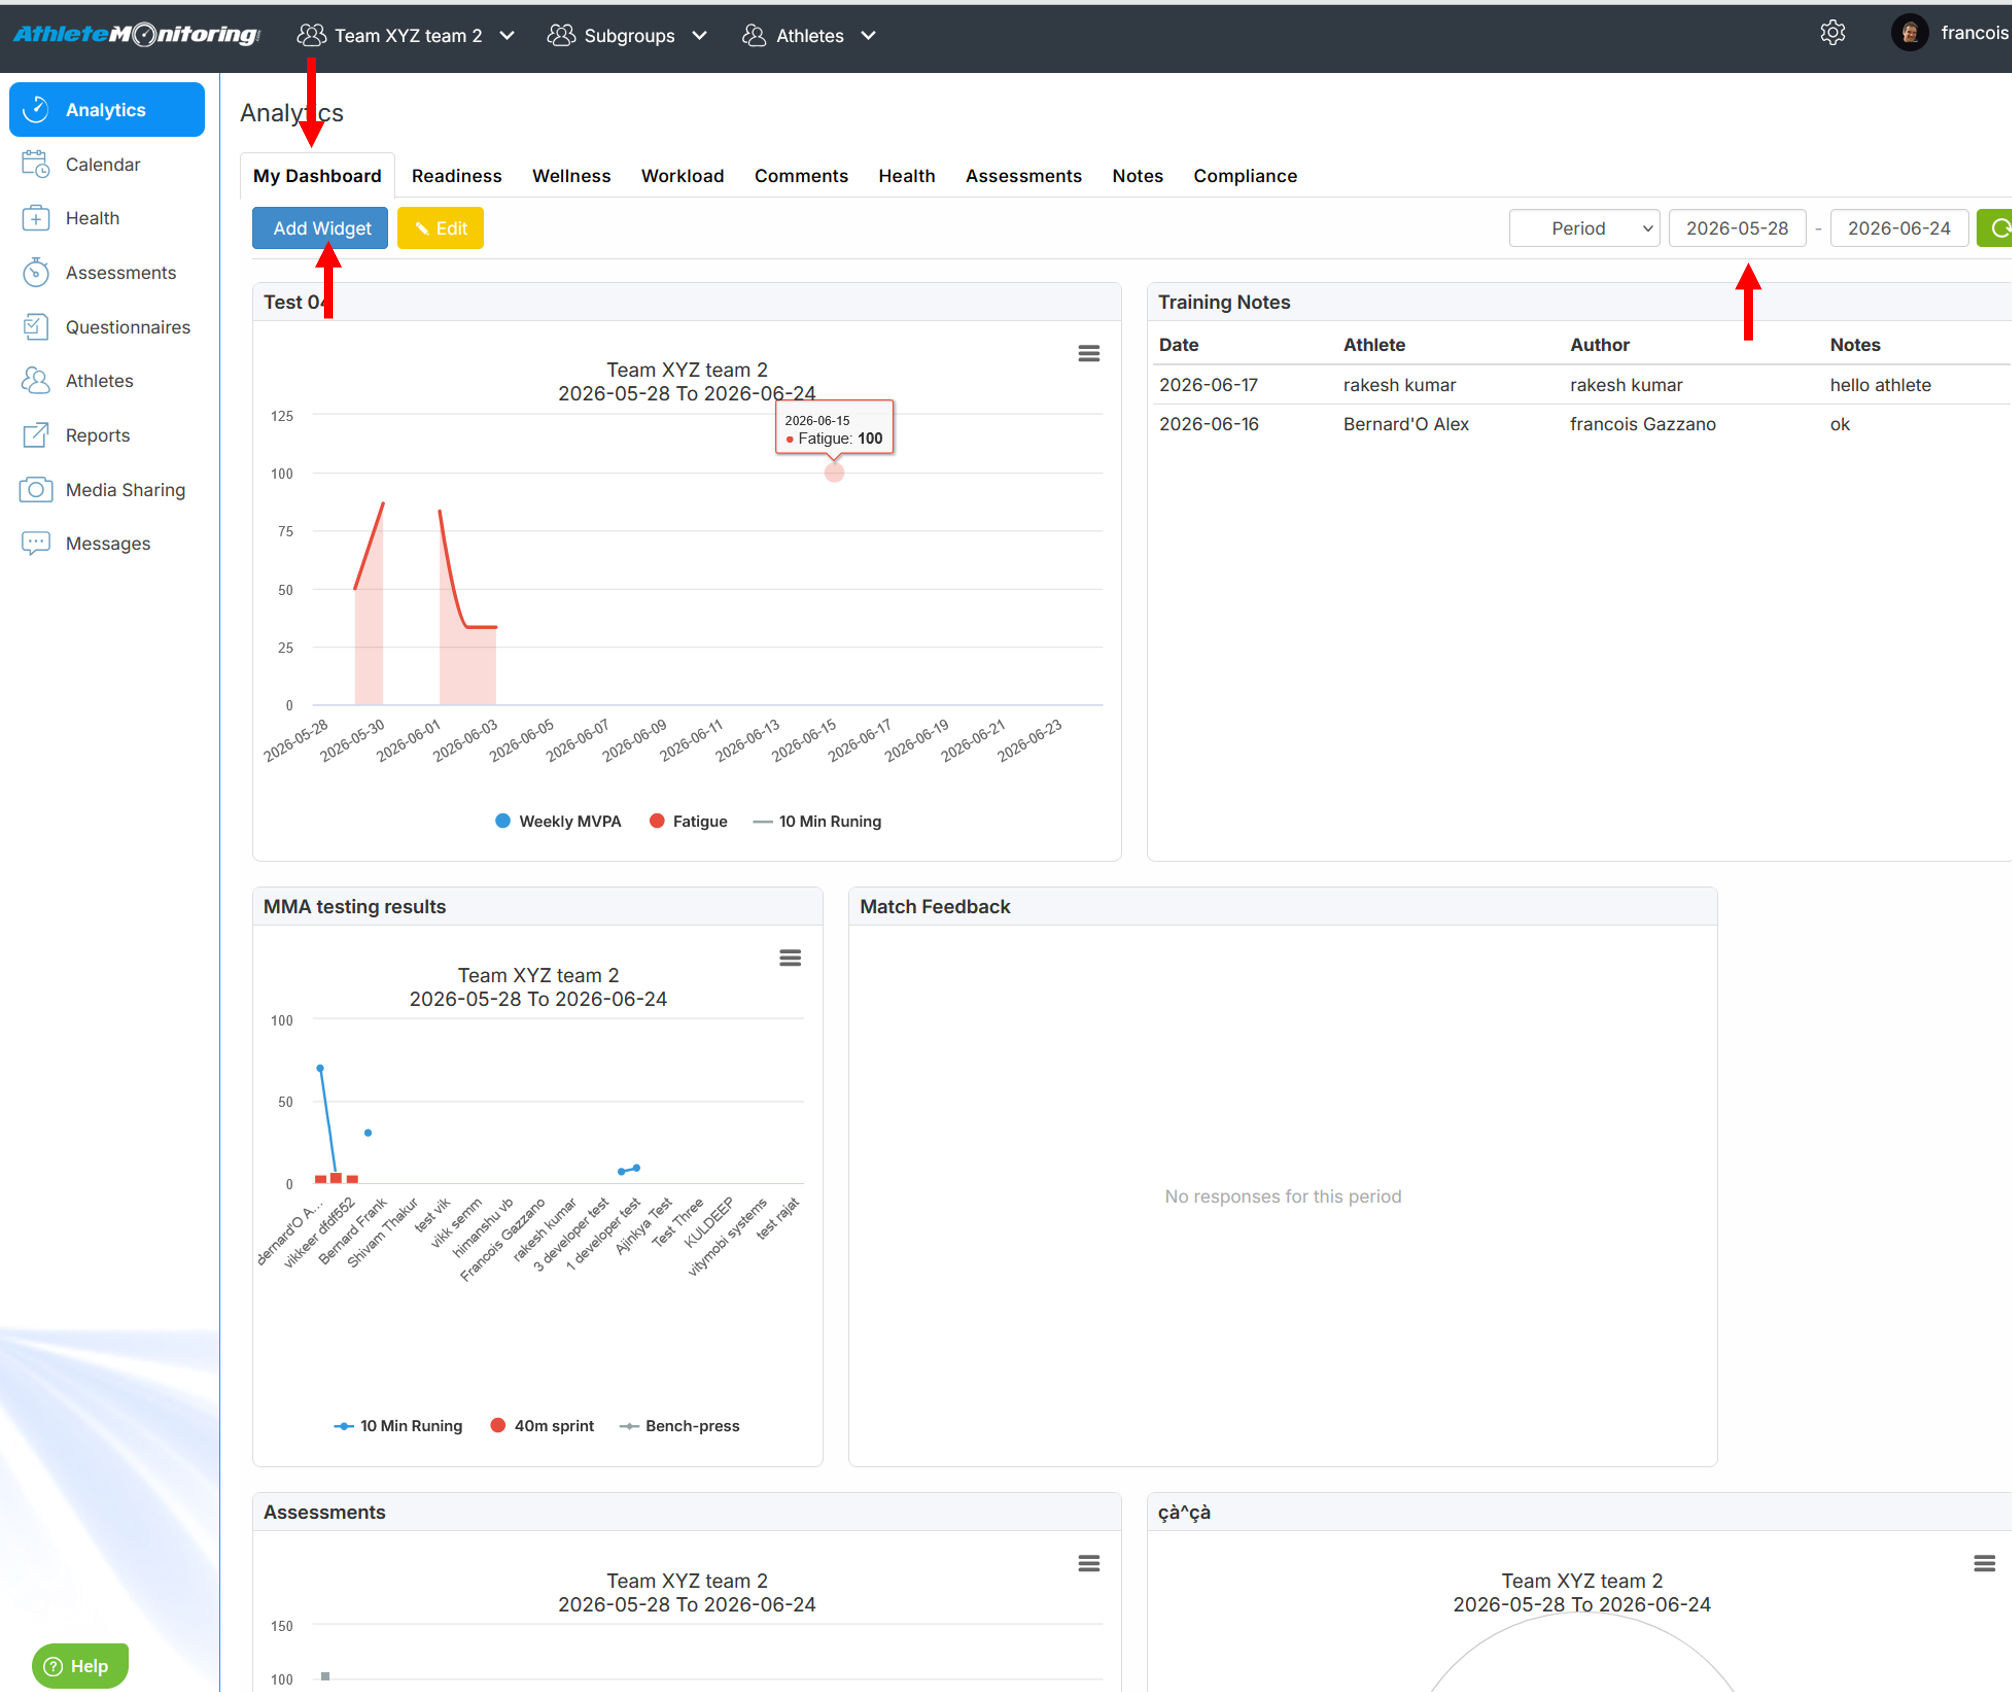
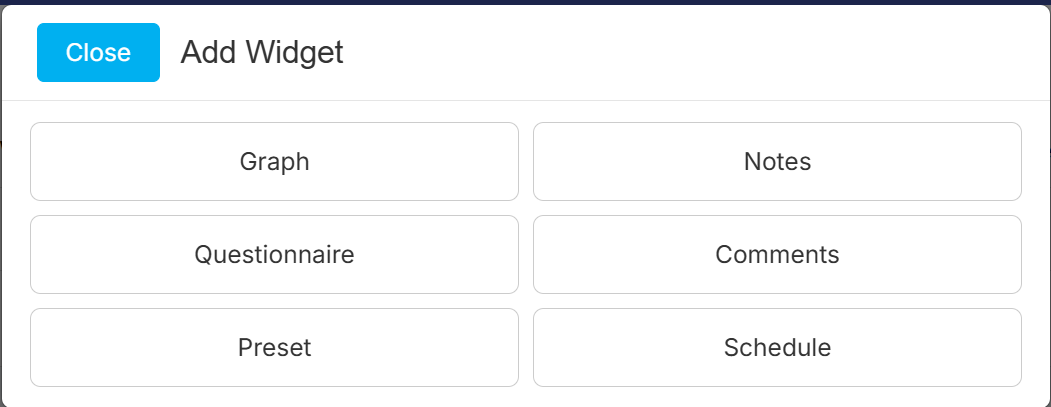
To add dashboard items, click Add Widget, select a widget, configure it and save.
To modify an existing widget, click Edit.
To resize an item, click edit and drag the bottom right corner. To remove items click Edit, select all items to be removed and remove.
Readiness
Overview
This dashboard provides a simple and multifaceted analysis of wellness, screening, testing, training, competition metrics and health risk factors to monitor individual response to training. This dashboard simplify the monitoring of the Training Stress Balance (TSB) and immediately identify athletes who are at risk of injury (red), those who aren’t coping well with their workload (yellow), those who are not training at their full potential (blue), and those adapting well to the workload and ready to perform (green).
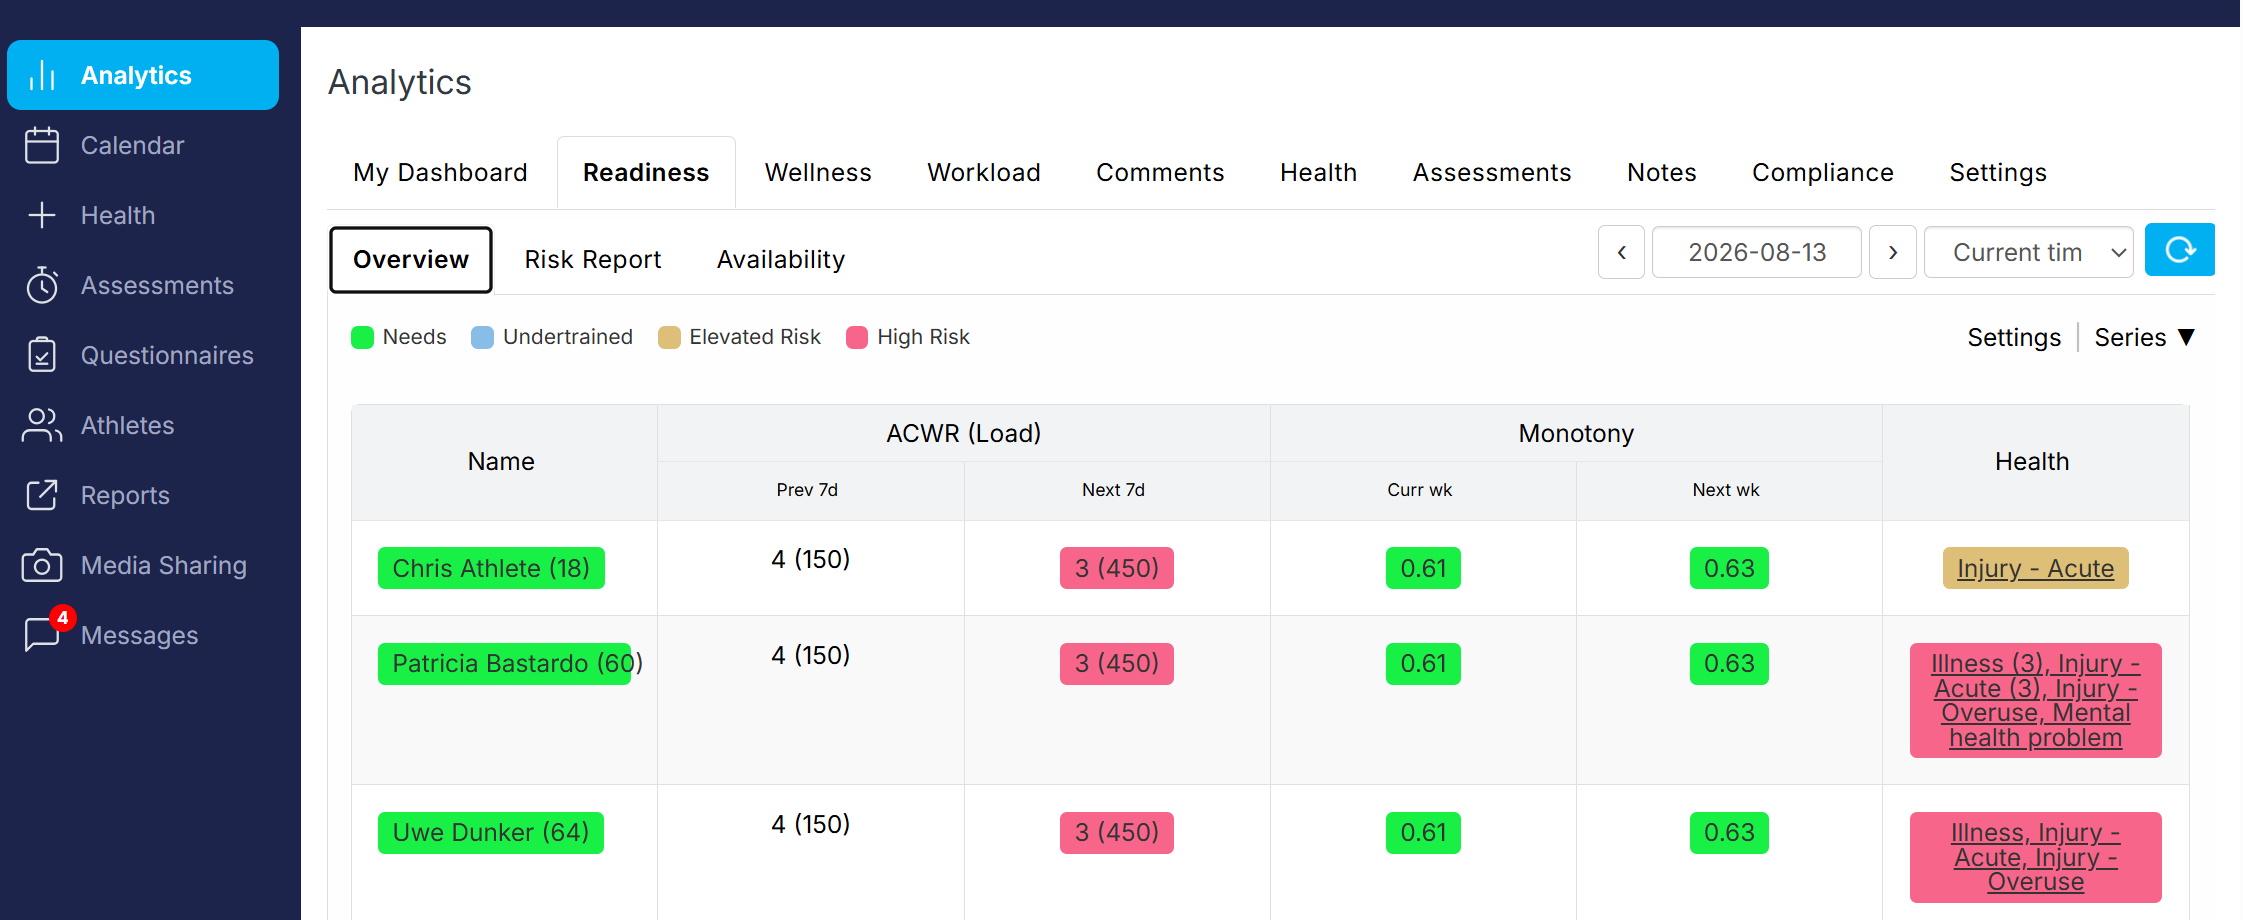
The athlete background colour indicates the overall level of risk/problems. Colours and text can be customized in Team settings-Alerts.
To open the individual dashboard and access individual alerts and recommendations, click on the athlete name. To add/remove items, click Series. To customize the alert system, click Settings.
Risk Report
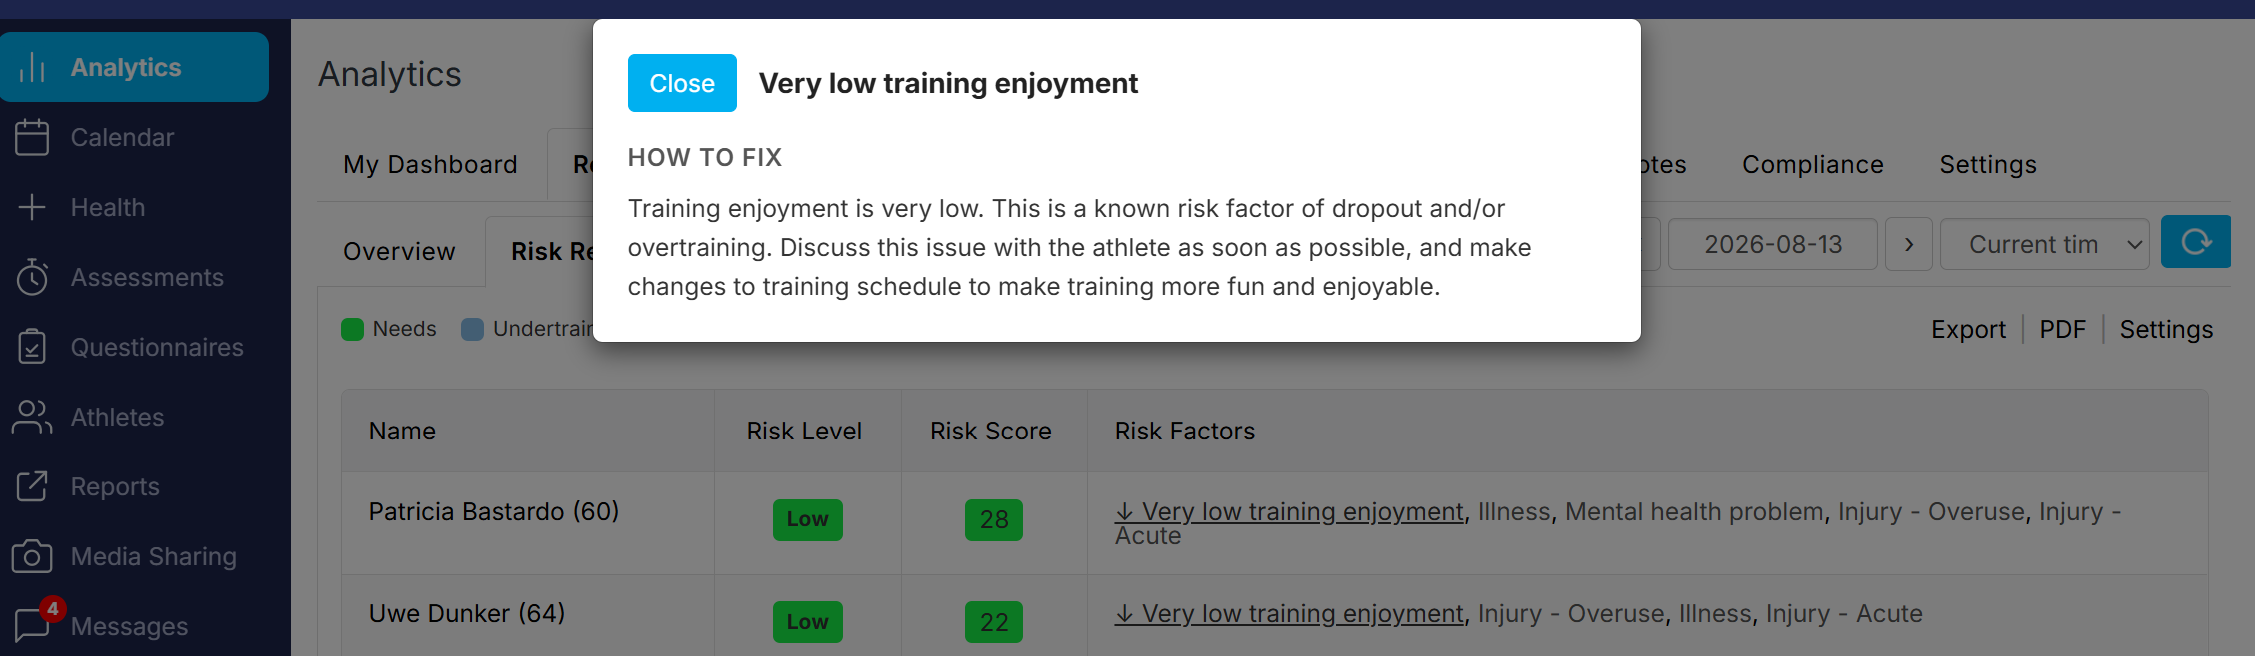
This dashboard list athletes based on their overall risk scores and levels, along with the corresponding risk factors. Click on each risk factor to access more information and how-to-fix recommendations. How is risk score calculated.
When available, click on the small gear icon to add how-to-fix recommendations. How to Configure Your Alert and Risk Scoring System.
Availability
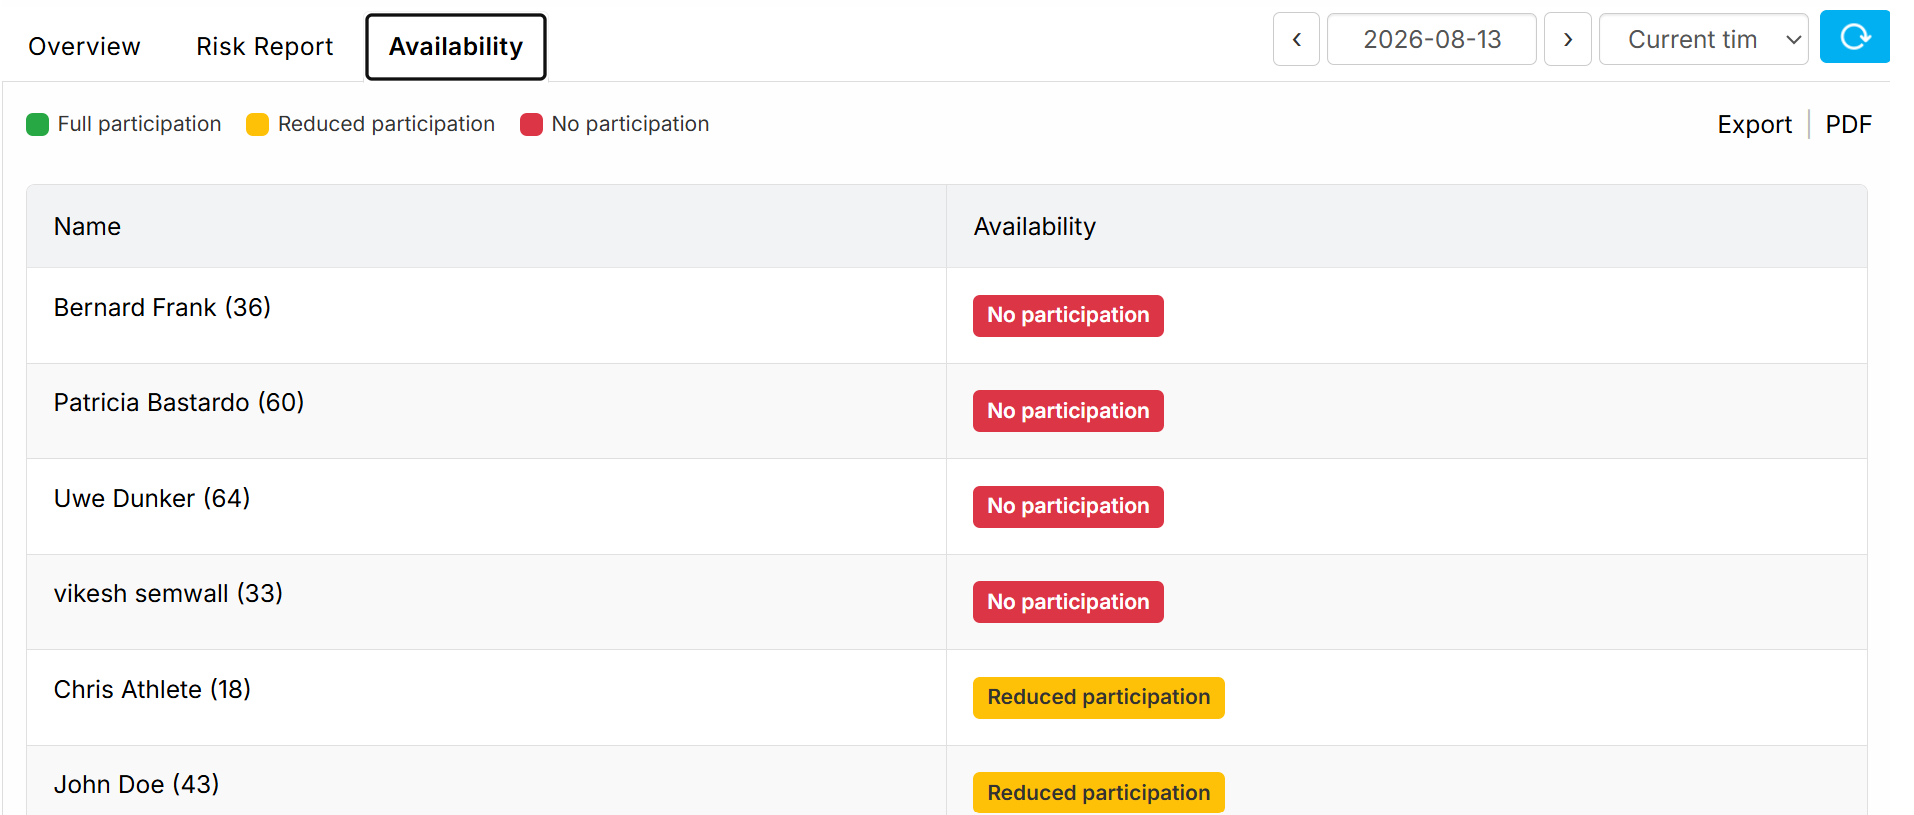
This section displays the list of available, partially available and not available athletes due to health problems.
Wellness
Overview
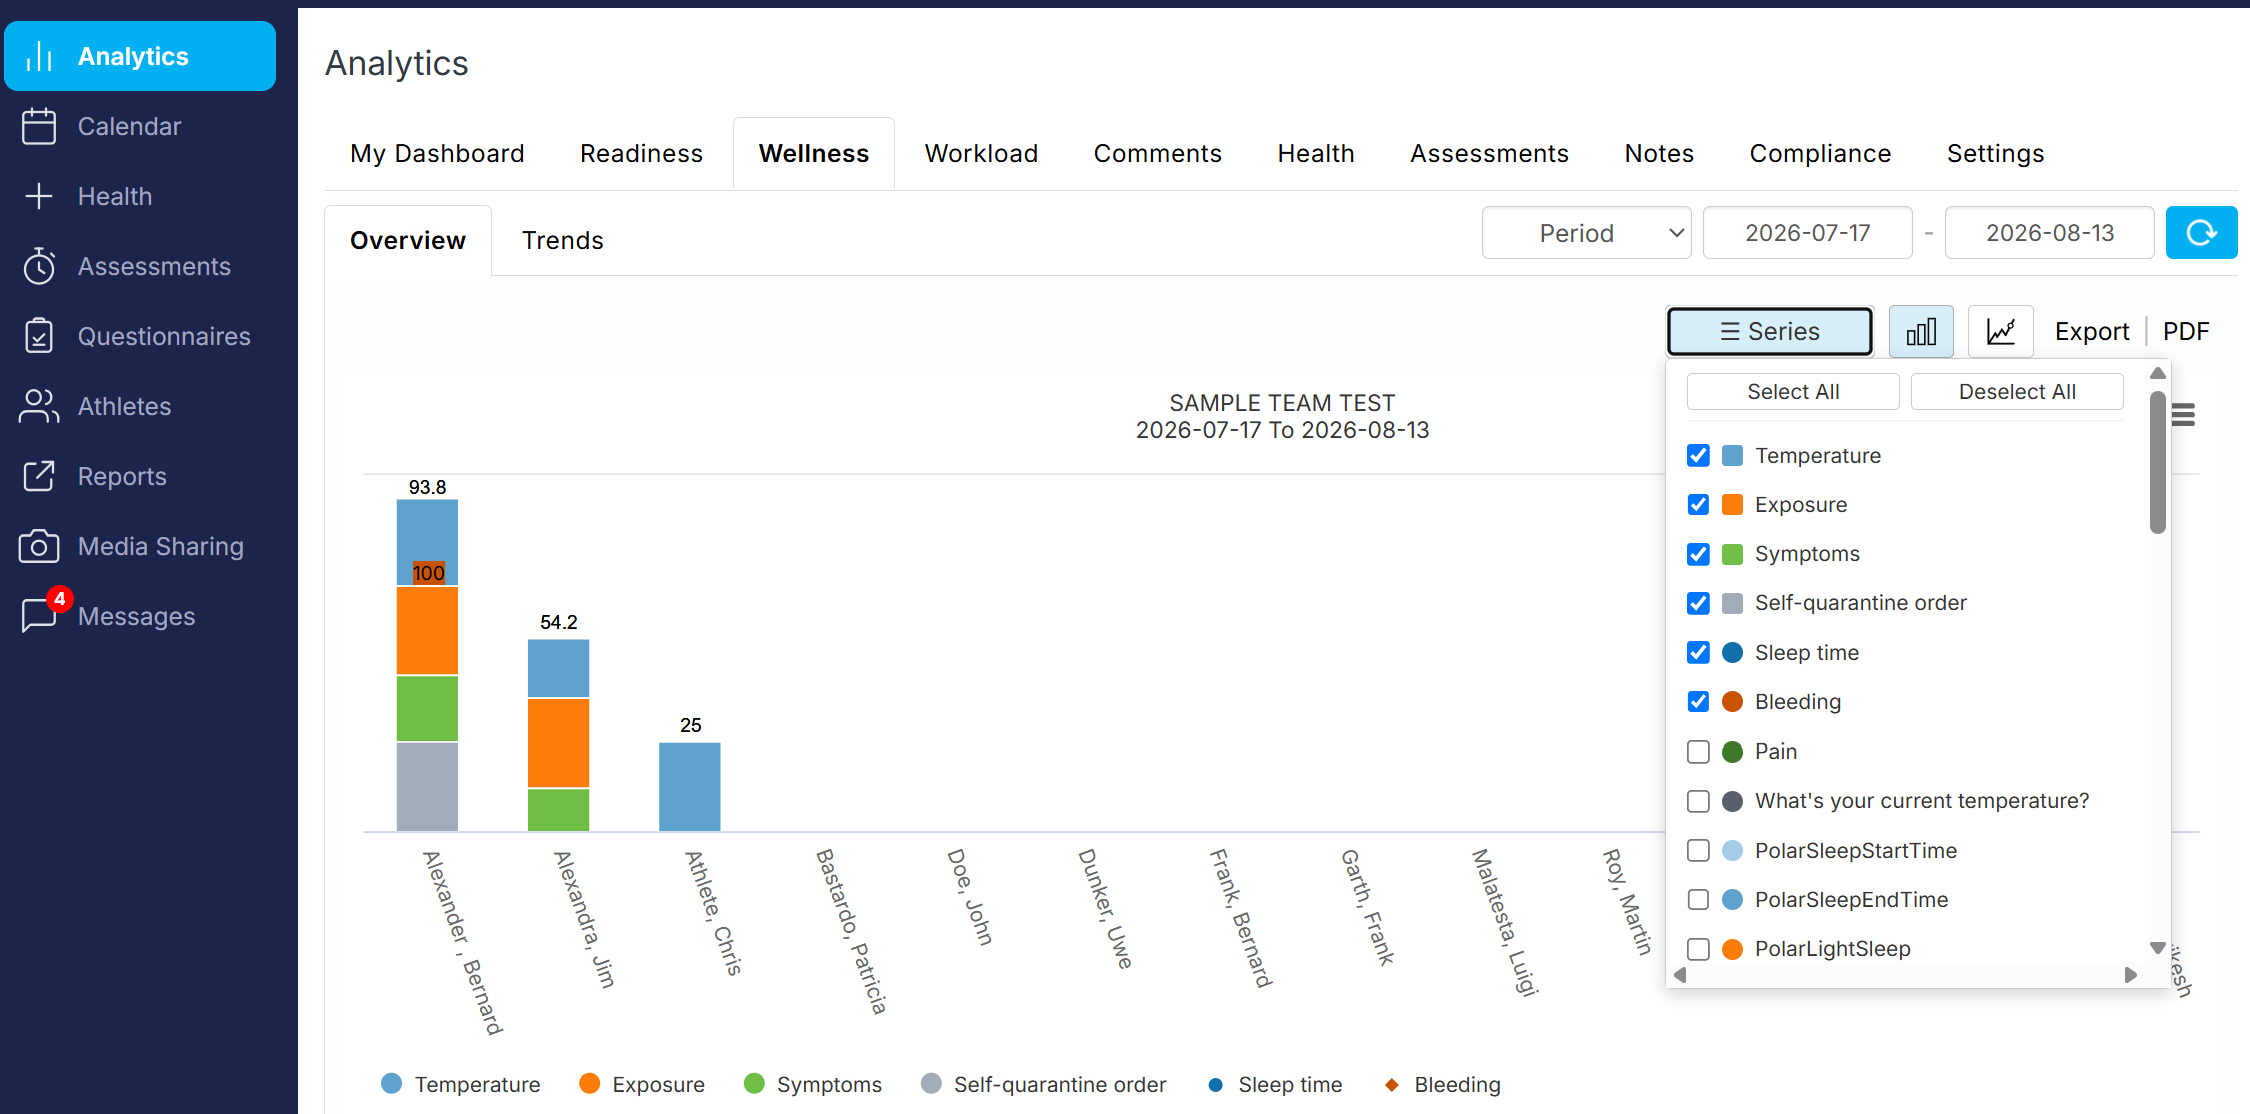
This graph displays the overall scores for each wellness category and custom fields, for all the selected athletes and period. Click Series to add/remove items on the graph.
Trends
This graph displays the evolution of specific wellness measures for each athlete for the selected period. Data can be grouped by day, week, month. Click Series to add/remove athletes on the graph.
Workload
Overview
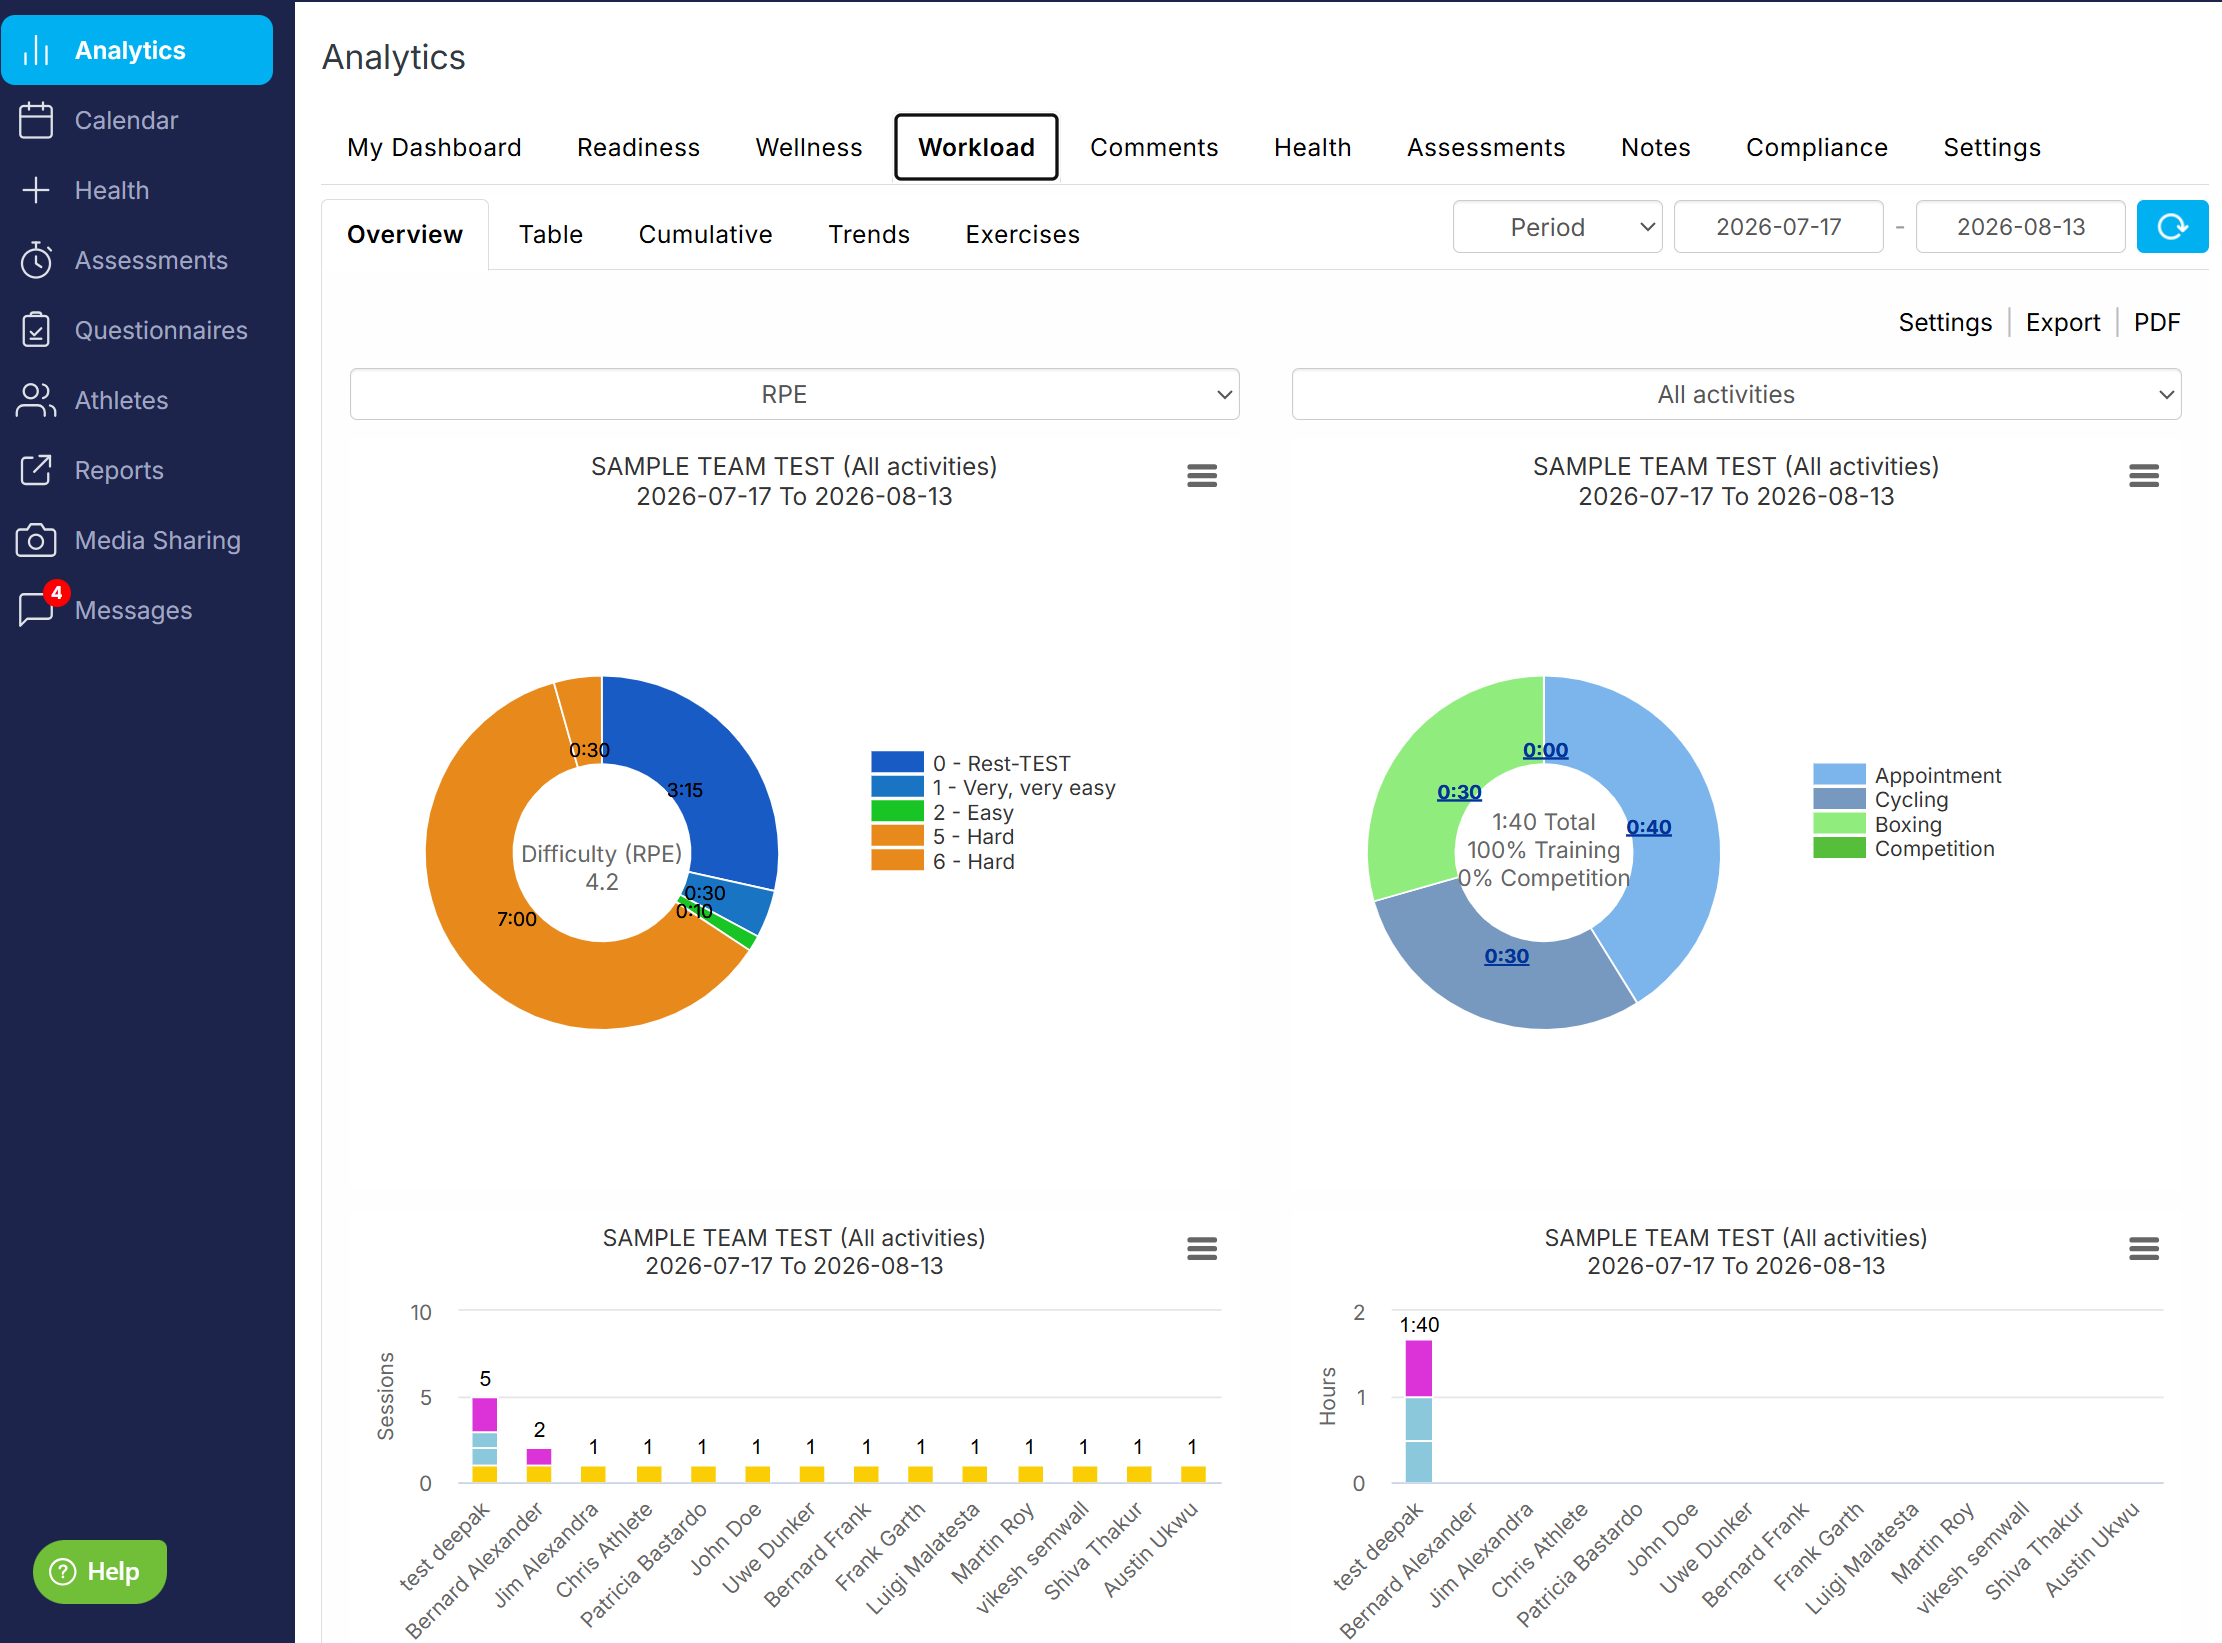
The first section of this tab presents the time spent in each sRPE zone, in each category of activity and activity (click on the blue links to expand the graphs and view the underlying numbers). The second section includes the time spent in each intensity zone, the number of sessions per athlete and the overall time spent in each sRPE zone for the entire group.
Table
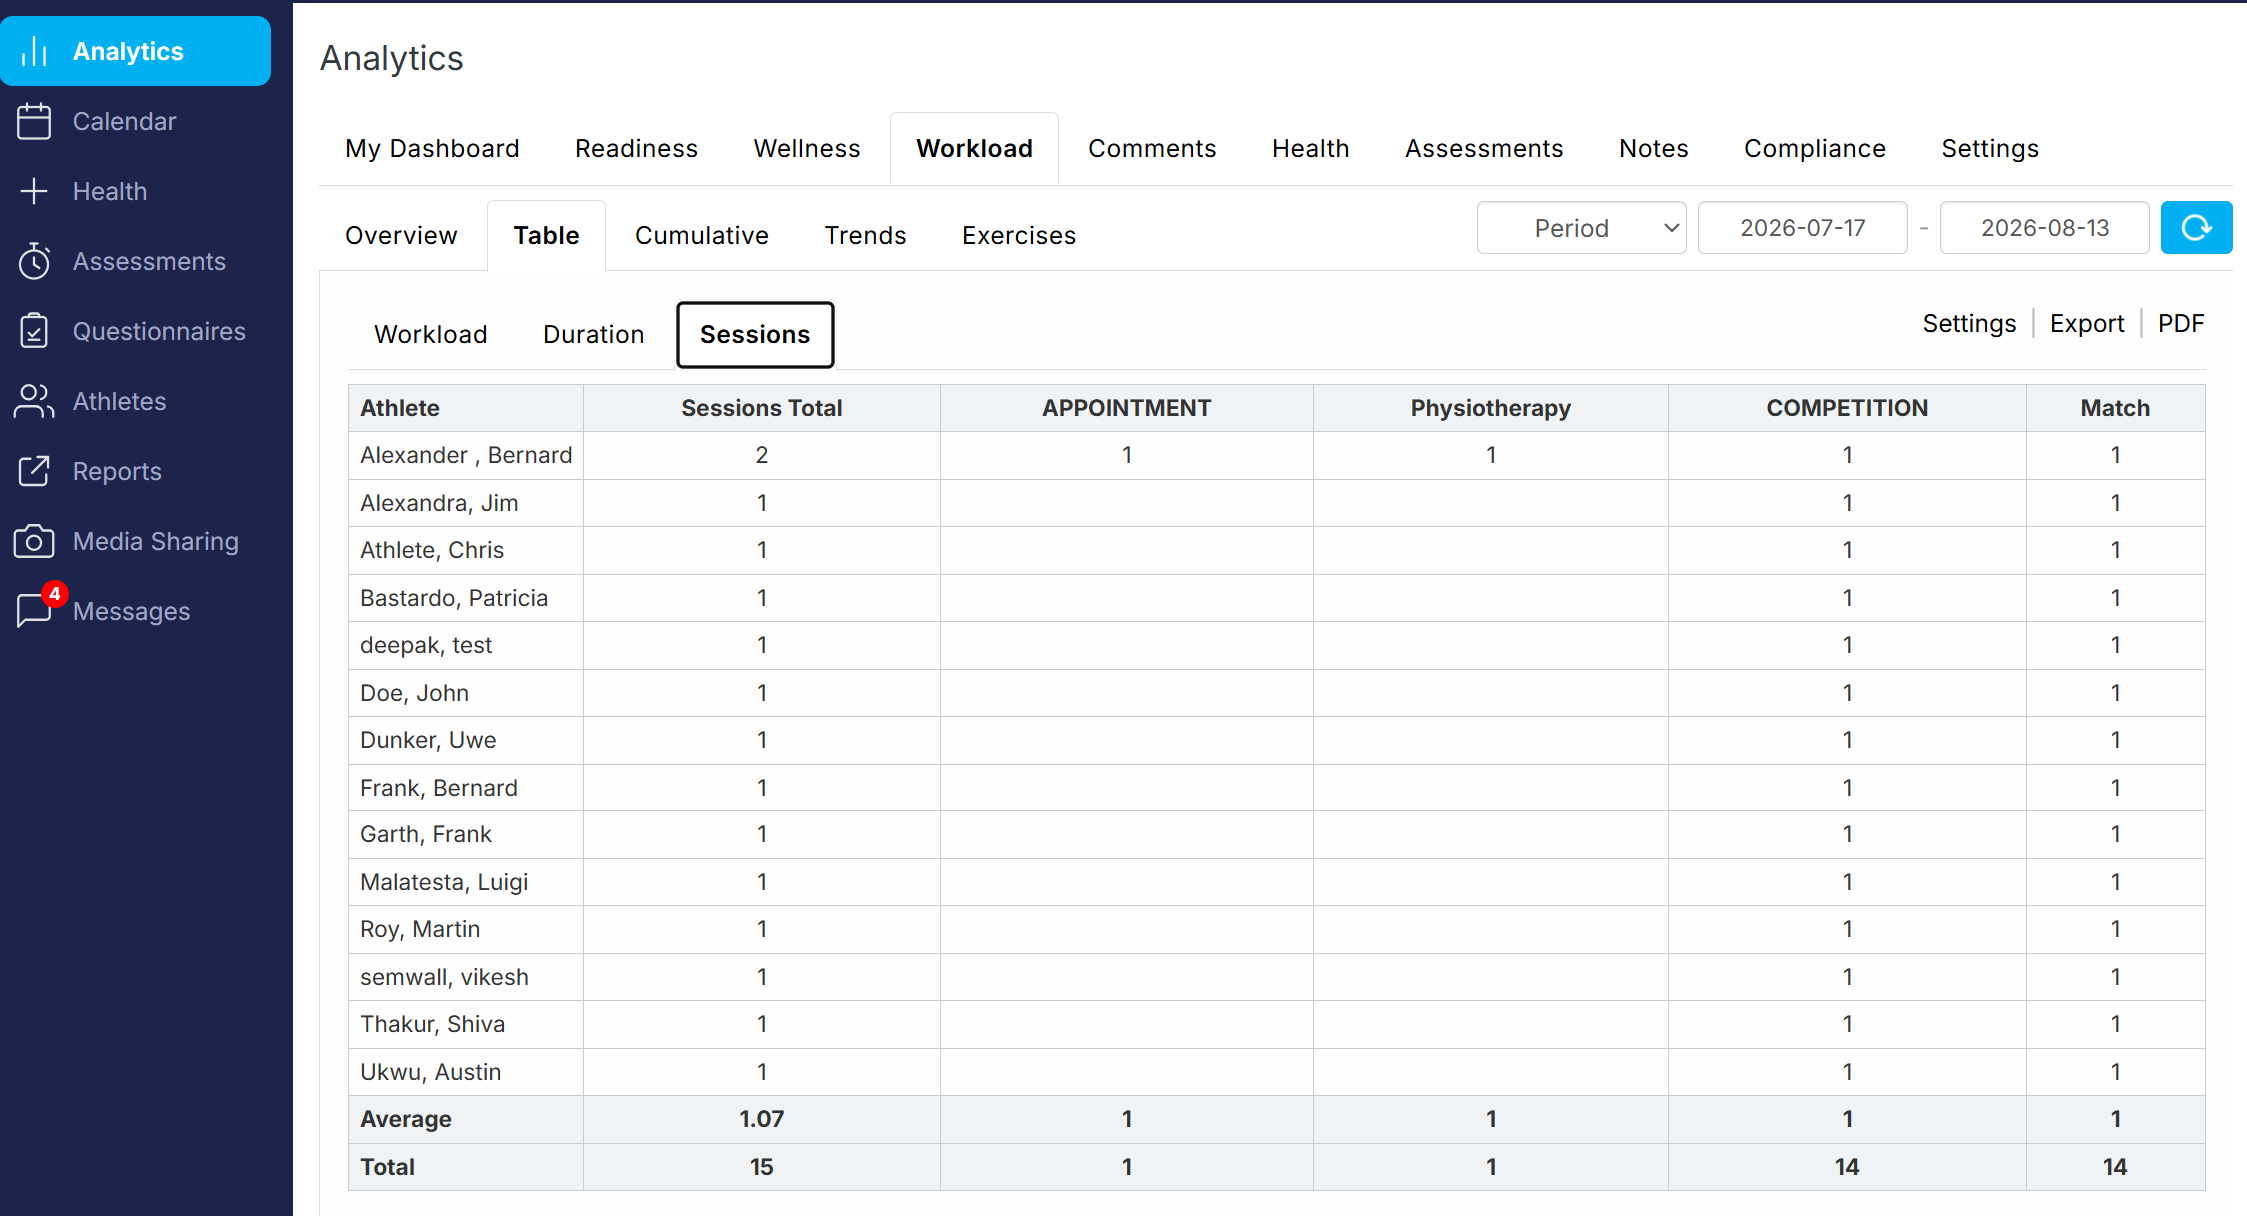
The Duration tab presents the number of hours spent in each activity and category for the selected period. The Sessions tab displays the number of sessions performed for the selected activity, activity category, period and athletes.
The Average and Total rows include the corresponding group statistics.
Cumulative
This section presents a graphical summary of specific workload metrics for the selected activity, activity category, period and athletes.
Trends
This section presents a longitudinal analysis of the specific workload metrics and athletes, for the selected activity, activity category, period and athletes.
S&C (coming soon)
This section includes an in-depth analysis of strength and conditioning exercises, 1RM and the calculation of S&C training intensities.
Comments
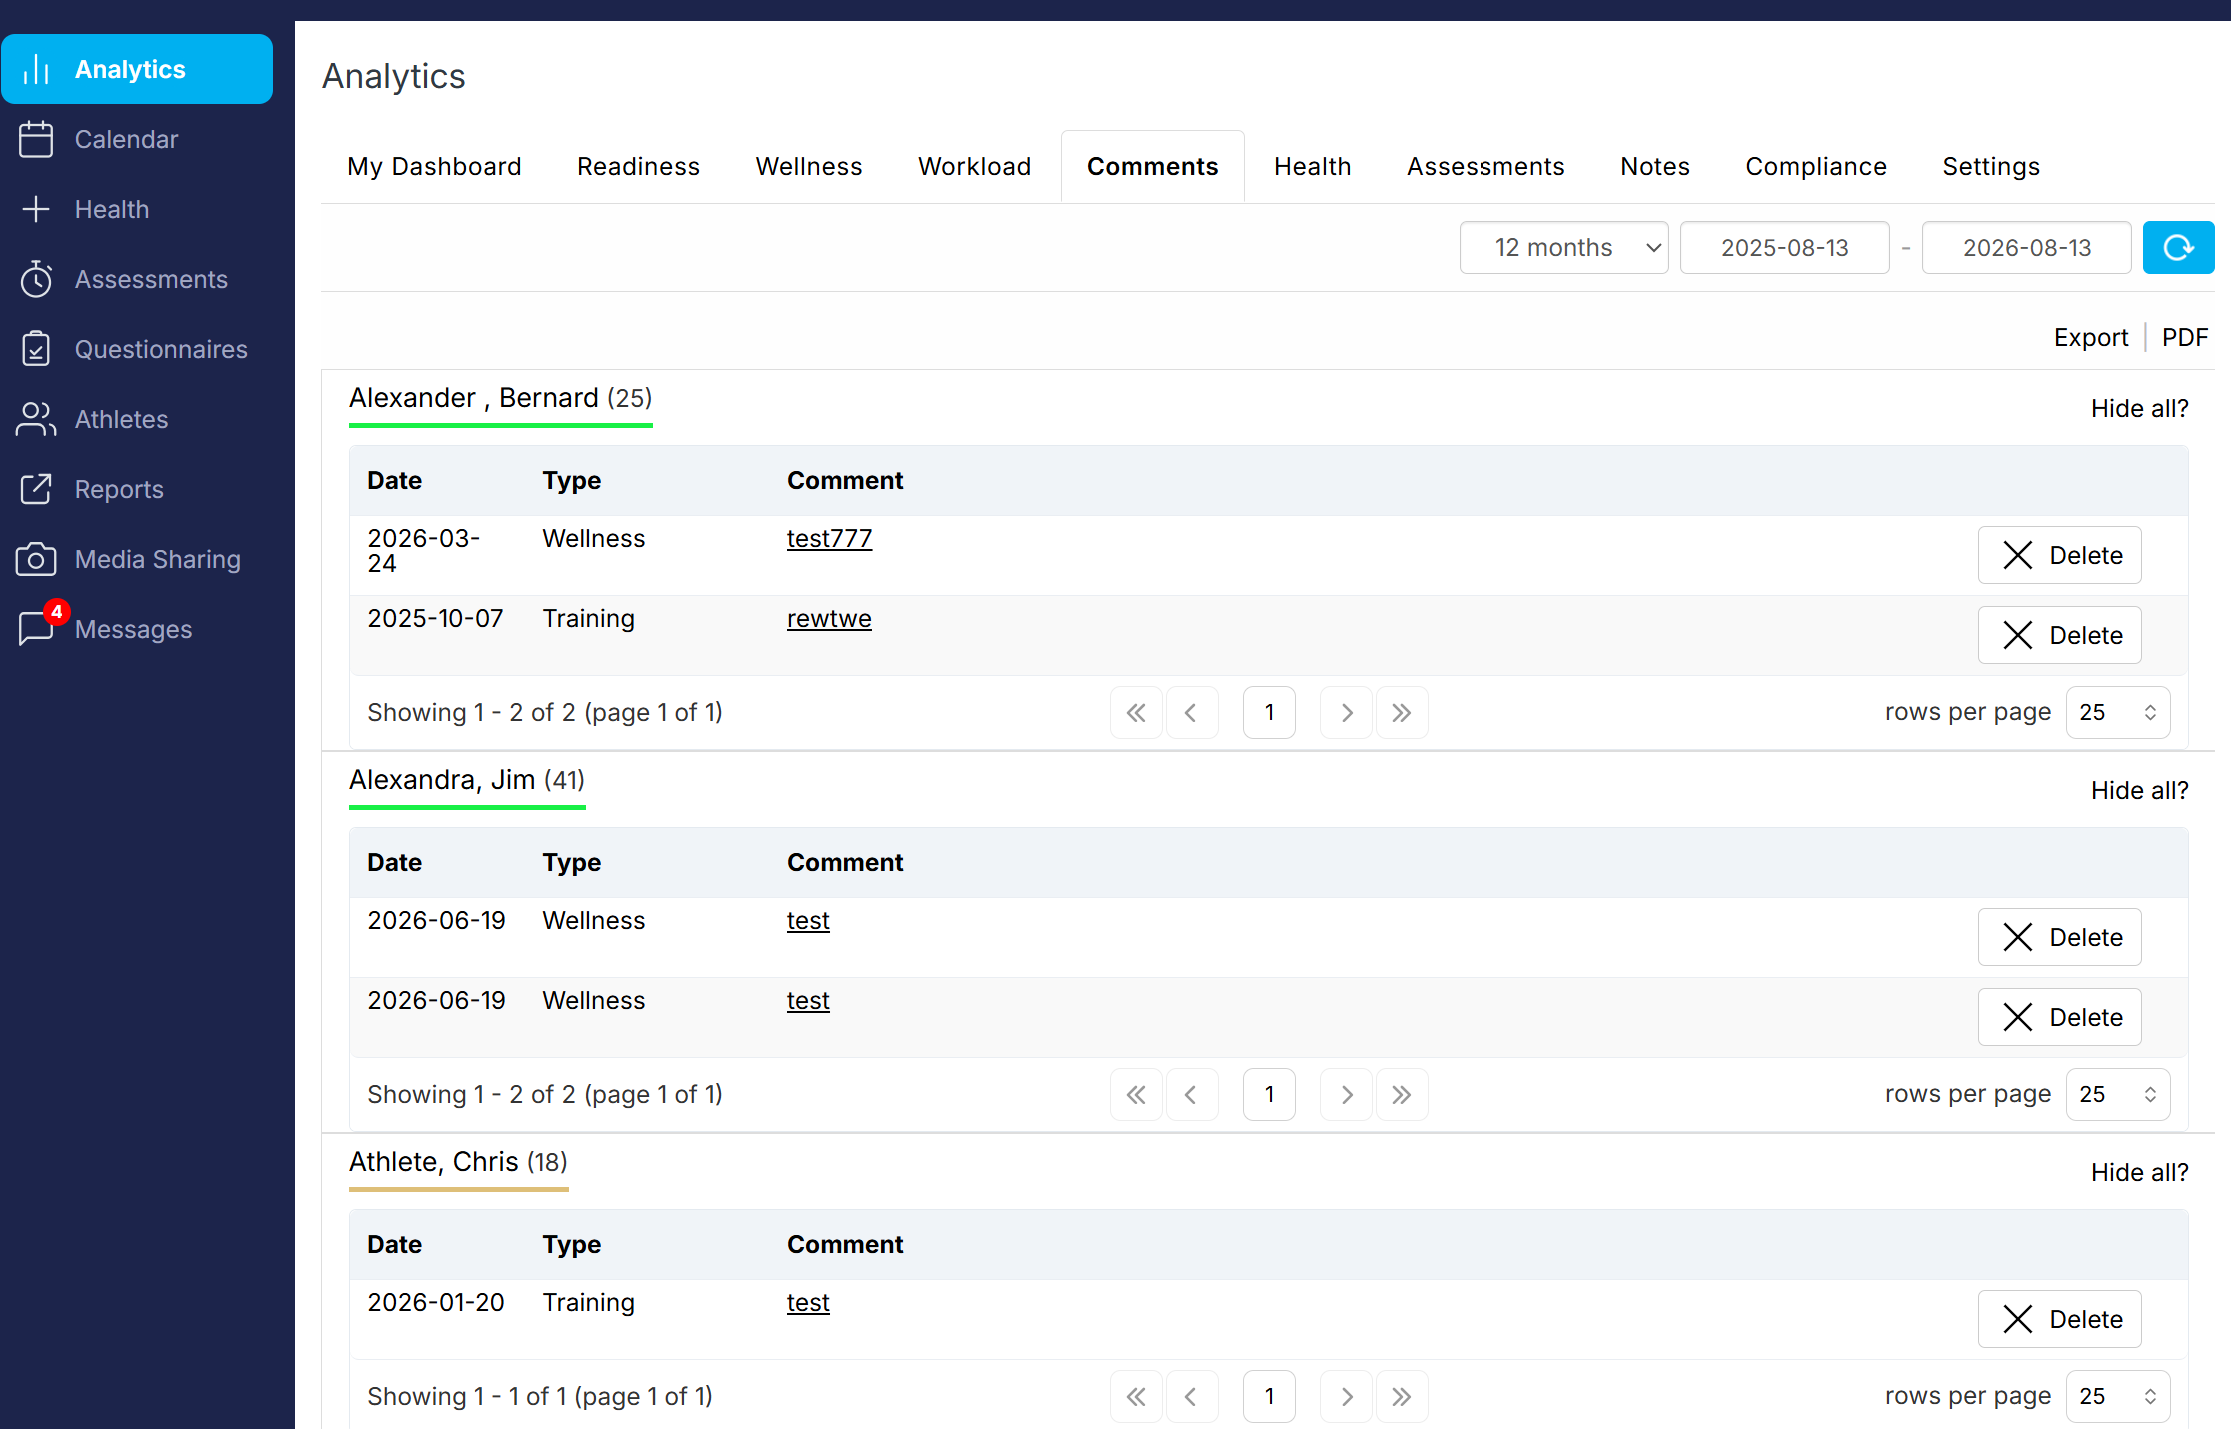
This section displays all comments reported by athletes when recording their wellness questionnaire or training forms. All columns can be sorted and filtered. Athlete availability status is represented by a coloured bar under each name.
Health
The Health tab dashboard simplifies injury and illness data visualization and epidemiological statistics for the selected team/subgroup/athlete(s).
Overview
The pie charts display the overall health problems and time loss statistics.
The bar graphs display the number of health problems and time loss for each team/subgroup/athlete(s)
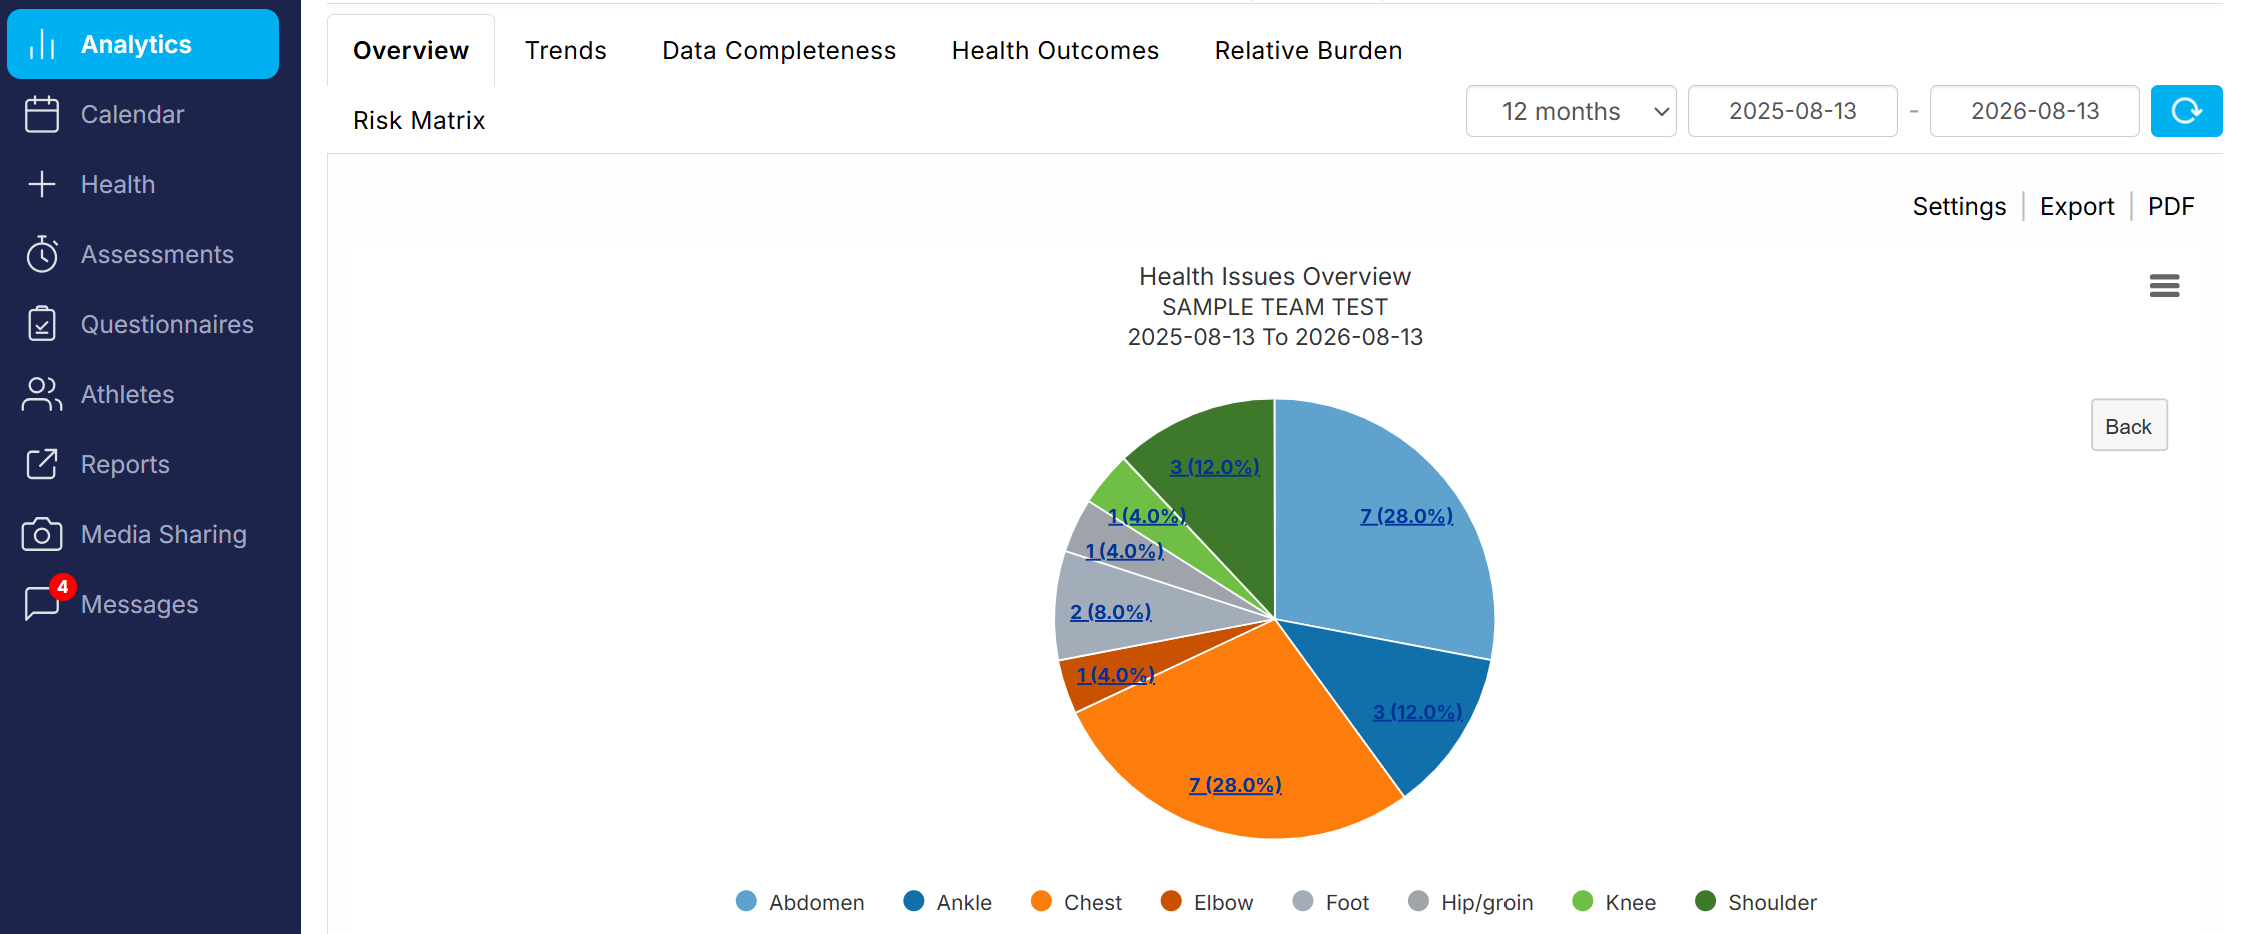
Click on the blue links to expand the graphs and view the underlying statistics. To remove graphs from the page, select the settings icon, located next to the Refresh (green) button, and deselect the graphs you do not need.
Trends
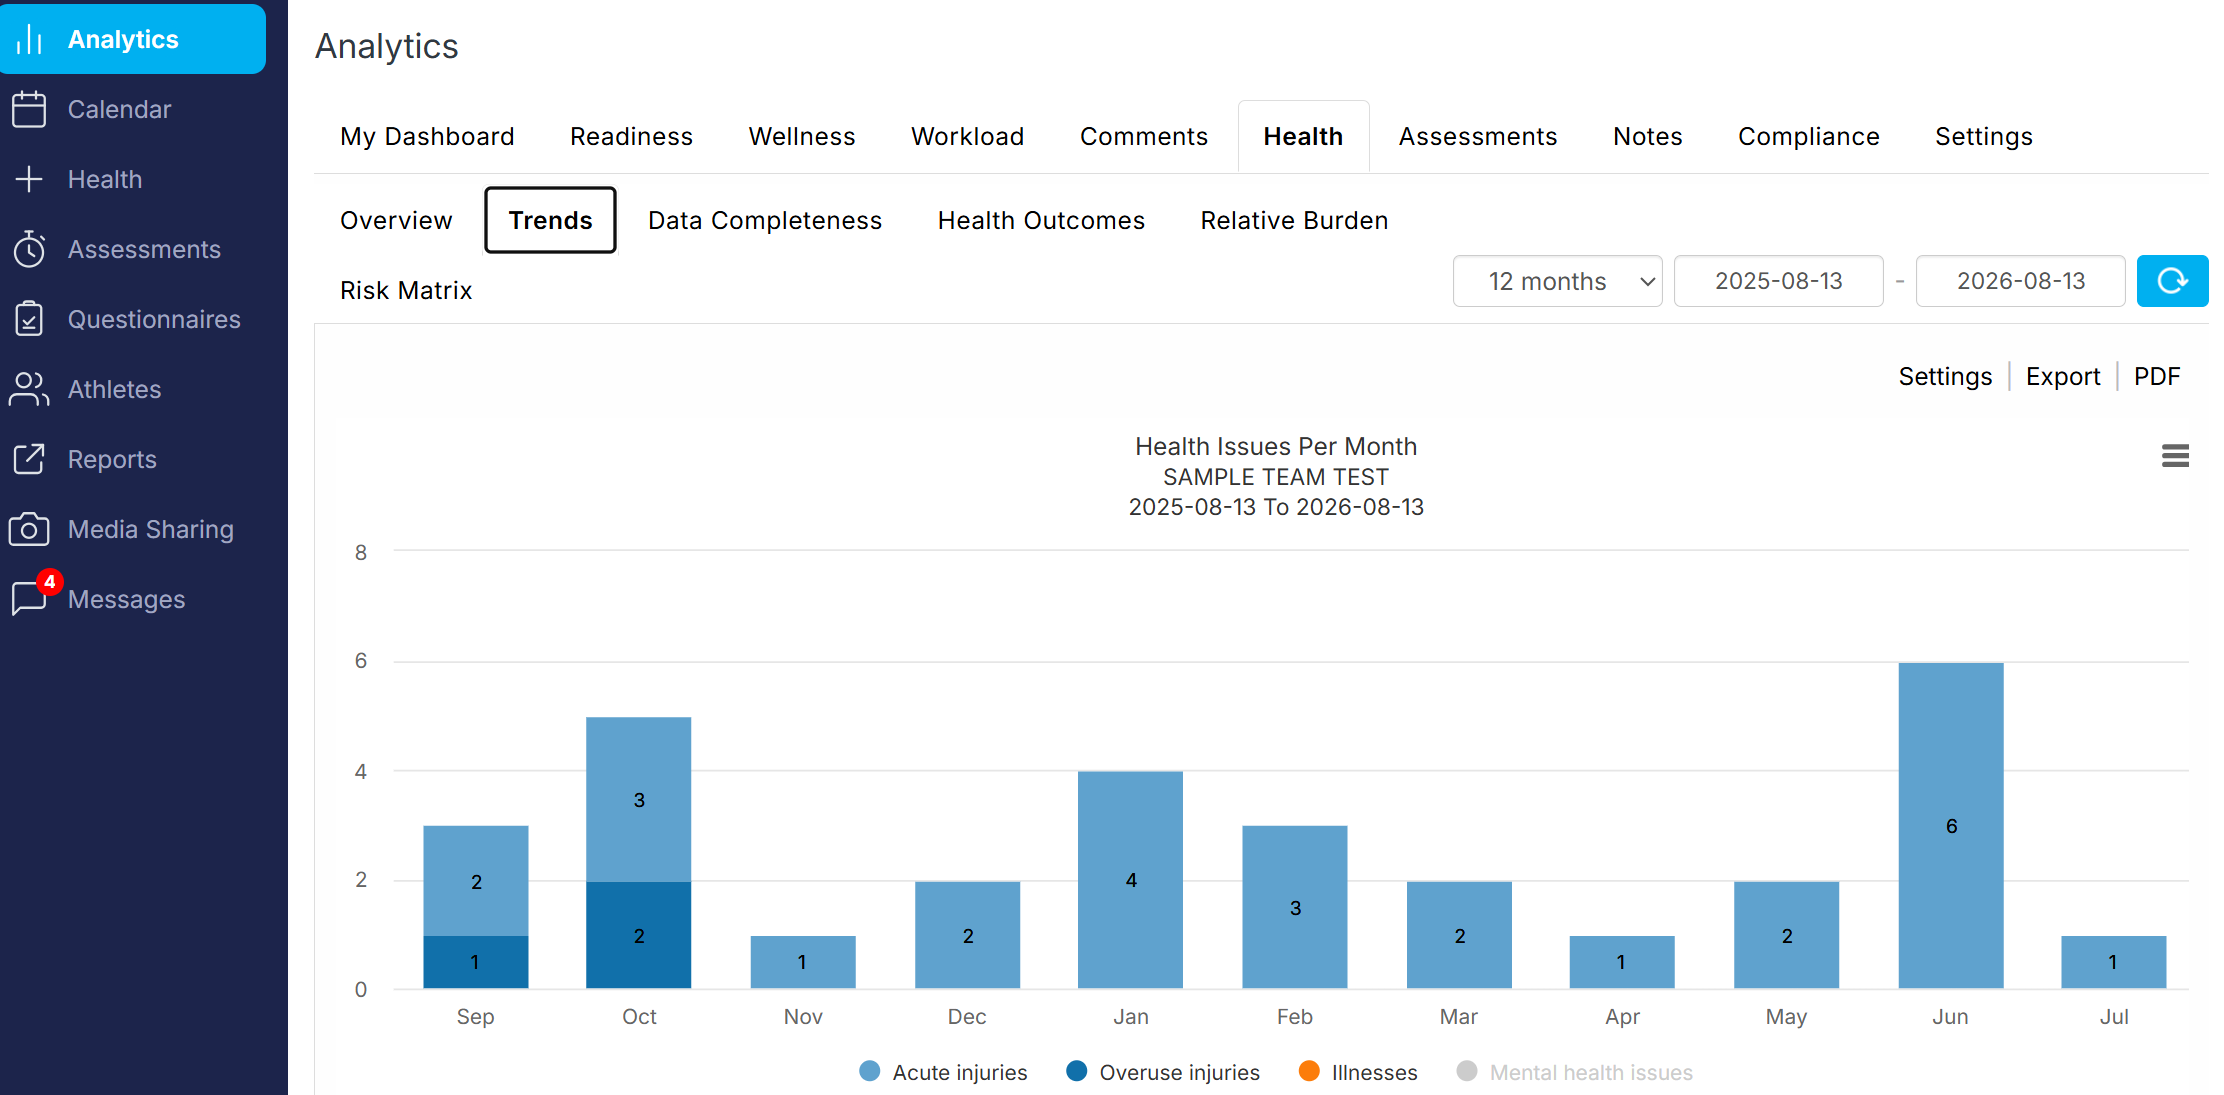
This section presents monthly and yearly longitudinal statistics.
Data Completeness
This graph illustrates the number of injury and illnesses recorded by the medical team and/or athletes (self-reported health problems), and the number of diagnoses recorded (diagnosis rates).
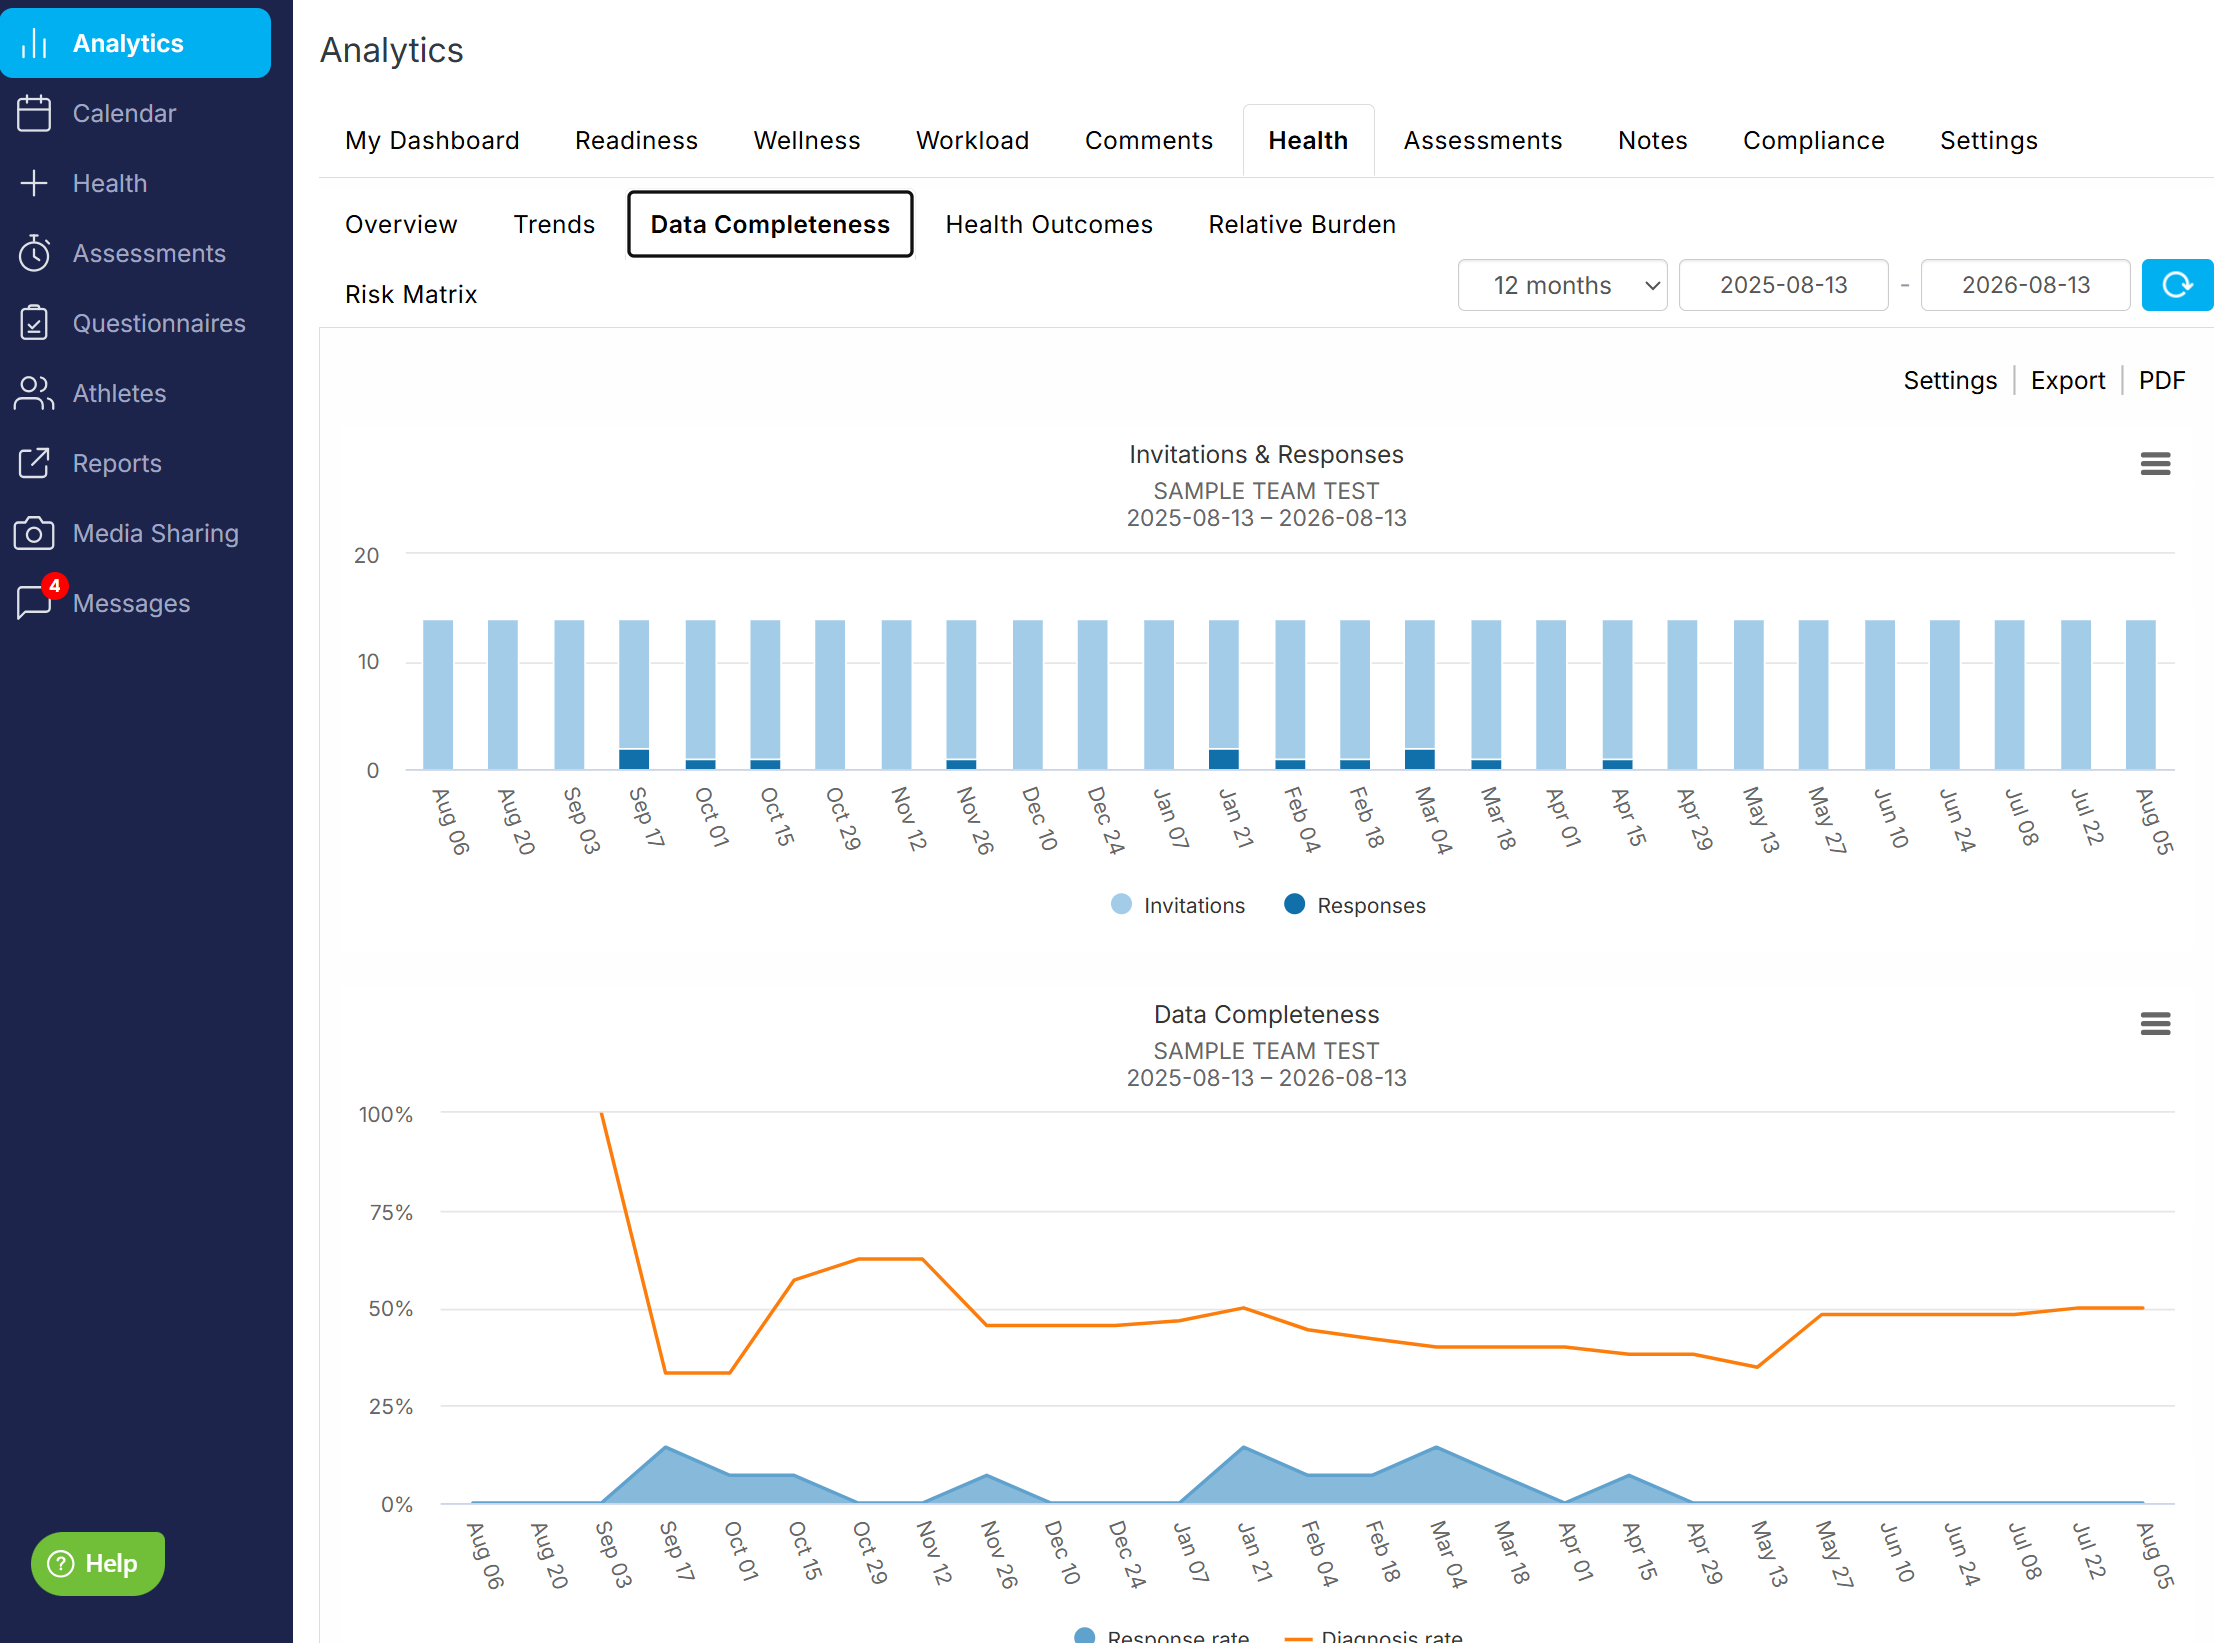
This graph illustrates the number of weekly OSTRC questionnaires completed by athletes (Response rate), or the number of recorded health problems, and the percentage of health problems diagnosed by health practitioners (Diagnosis rate).
Health outcomes
The first graph illustrates overall and weekly incidence of injuries and illnesses. Substantial problems are those that caused time loss.
The second graph illustrates overall and weekly prevalence of health problems (athletes with health problems at any given time).
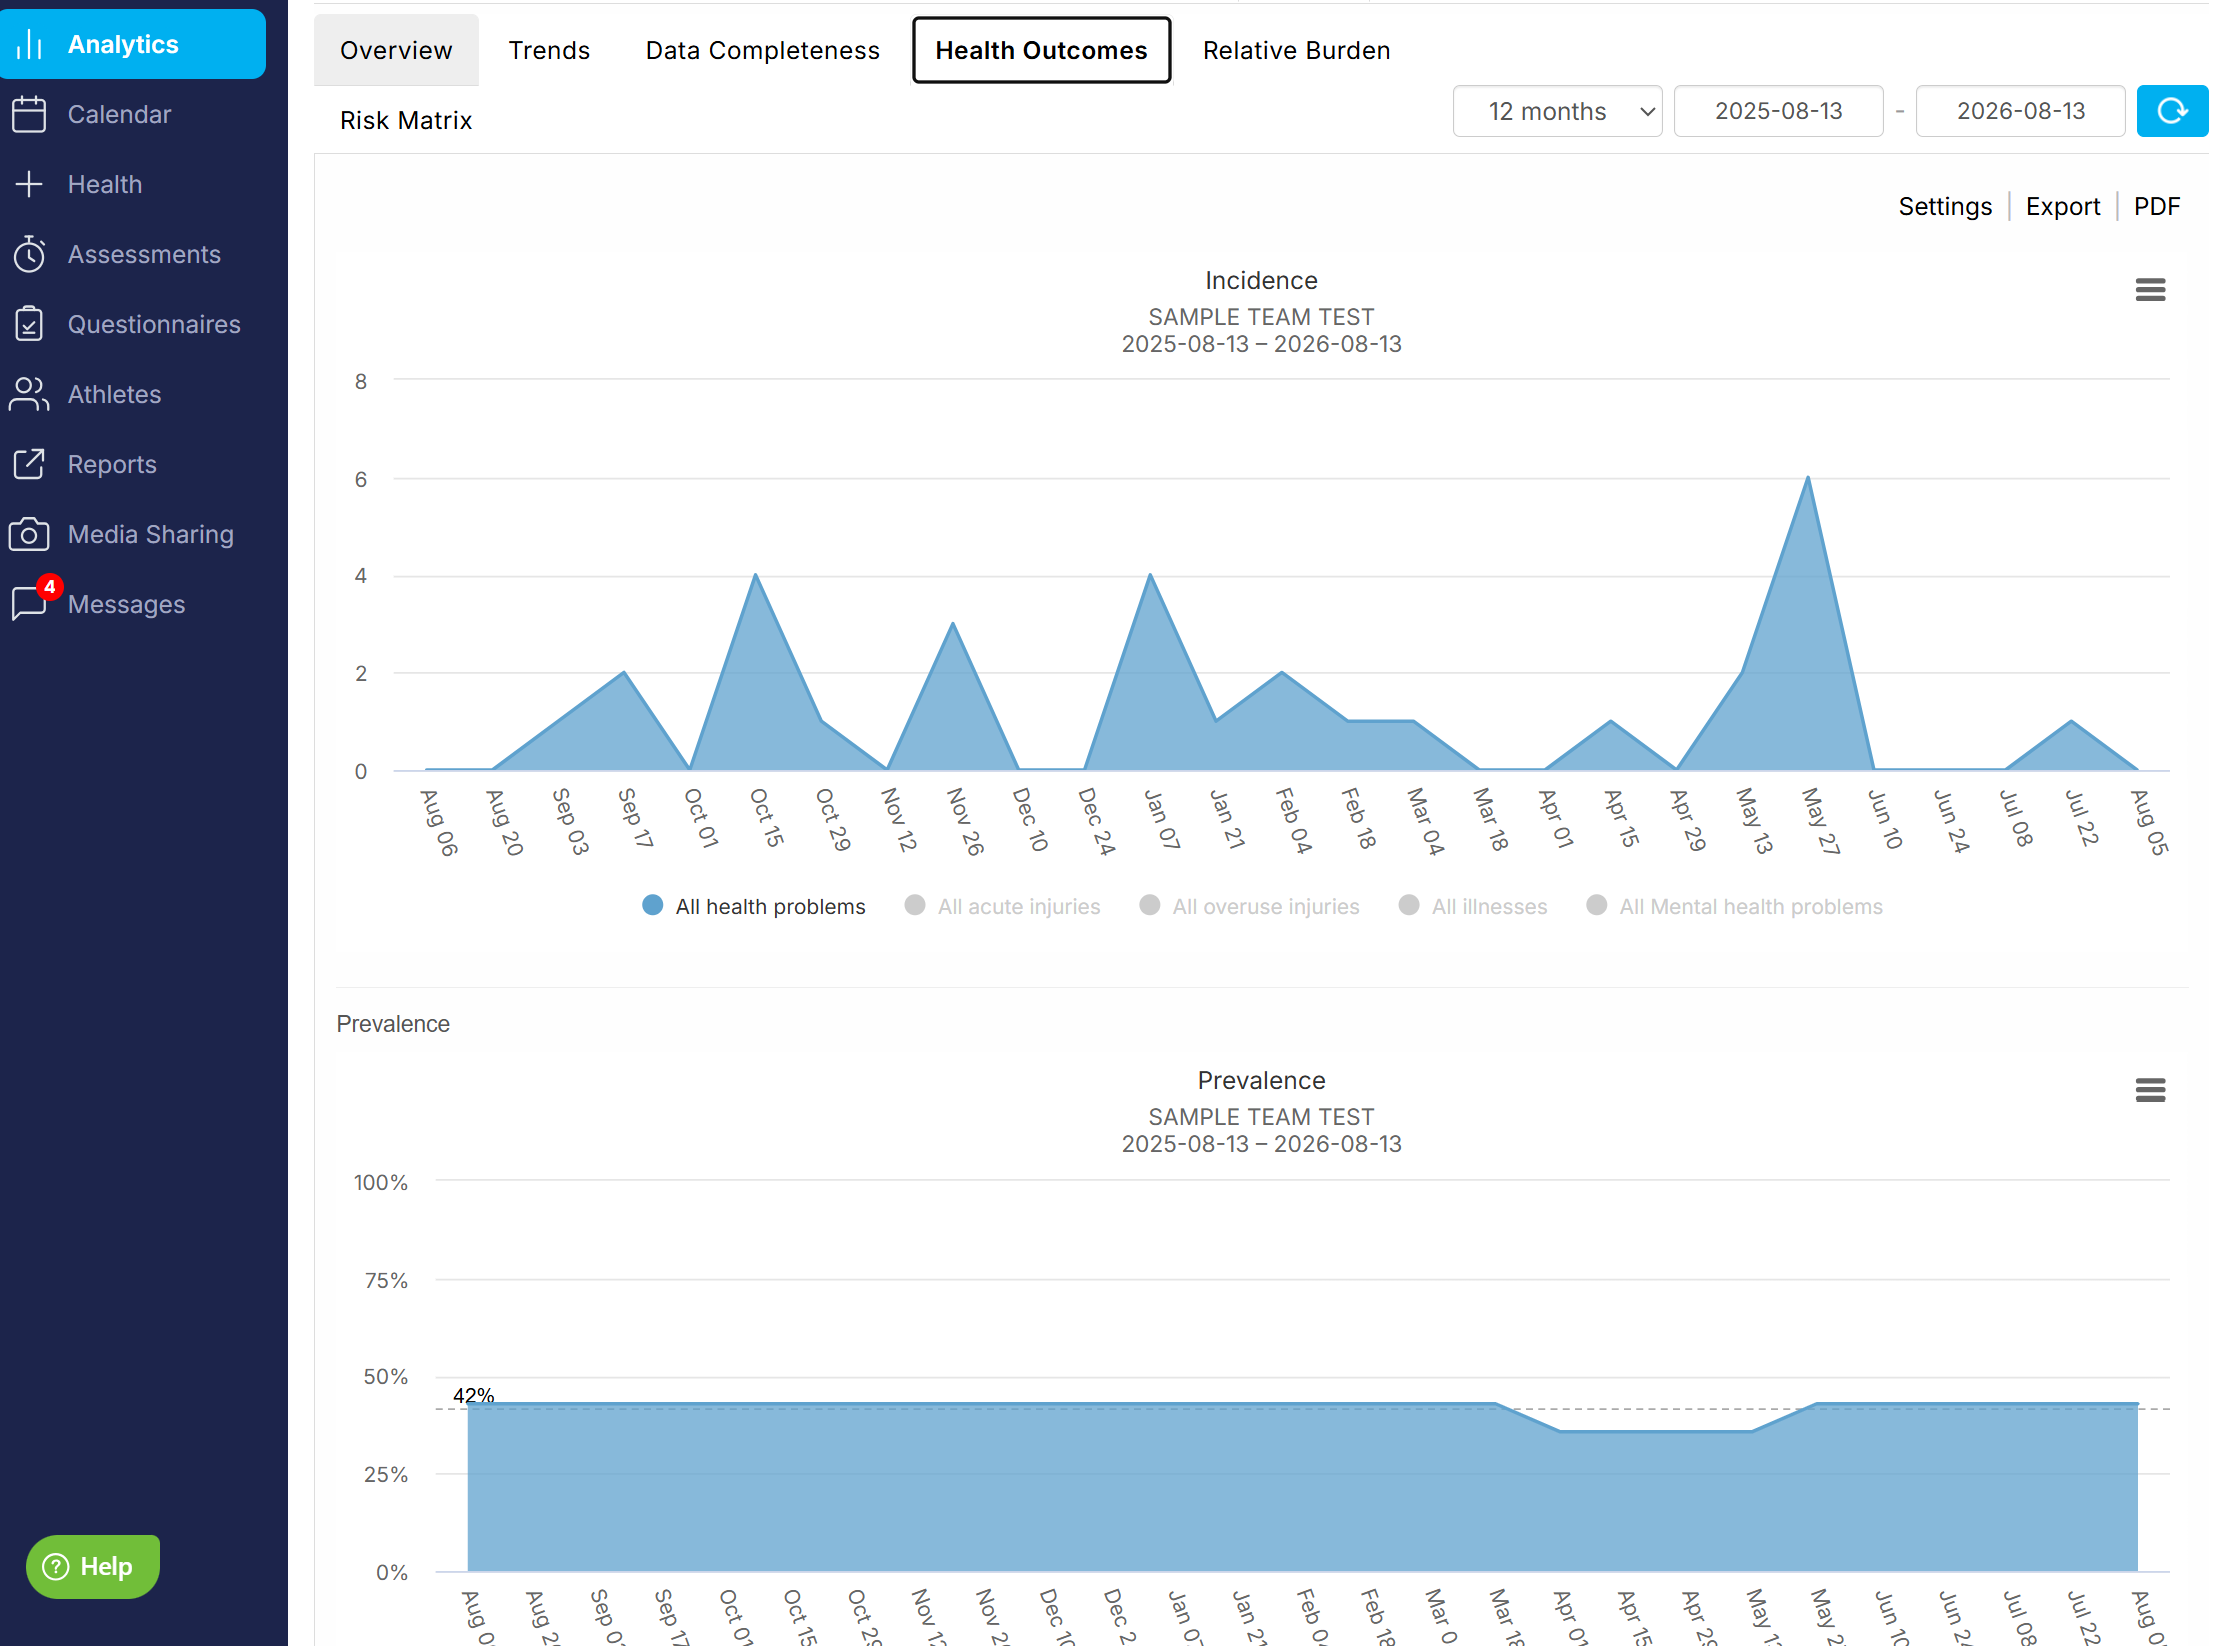
The data table under the graph includes detailed statistics. Incidence calculation method can be changed by selecting a different option in the dropdown list.
Relative Burden
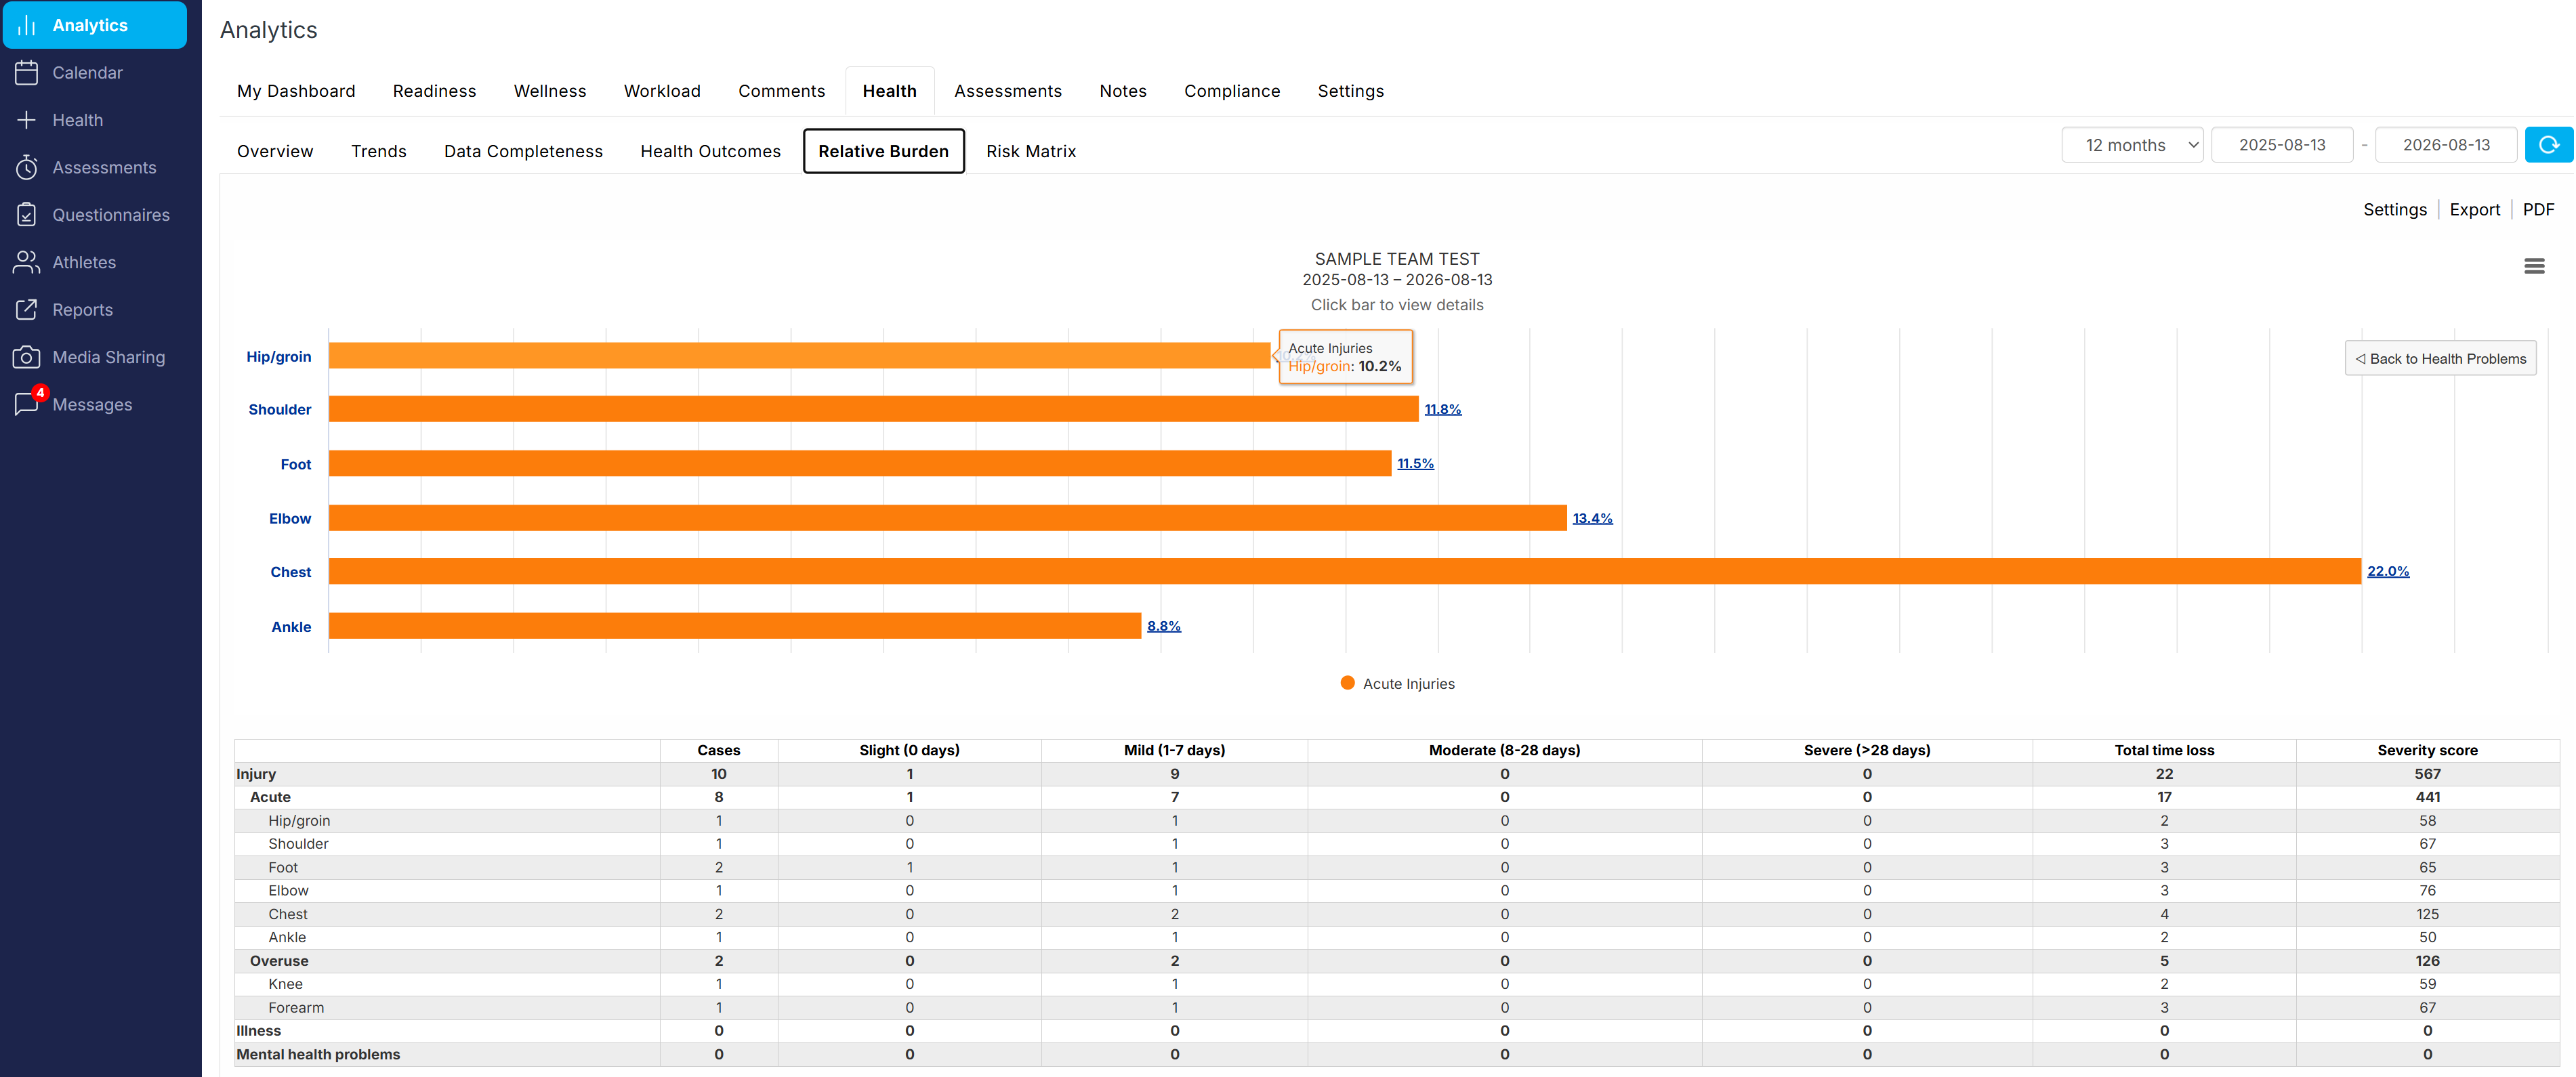
This graph illustrates the relative percentage of each type of health problem (acute injury, overuse injury, illness). Click on each bar to visualize detailed locations and diagnoses. The data table presents severity statistics using the traditional method (based on time loss).
Risk Matrix
The Risk Matrix illustrates the burden of selected health problems based on of time loss days and activities (based on selected options). The darker the yellow, the greater the burden. The vertical and horizontal error bars represent 95% confidence intervals (CIs).
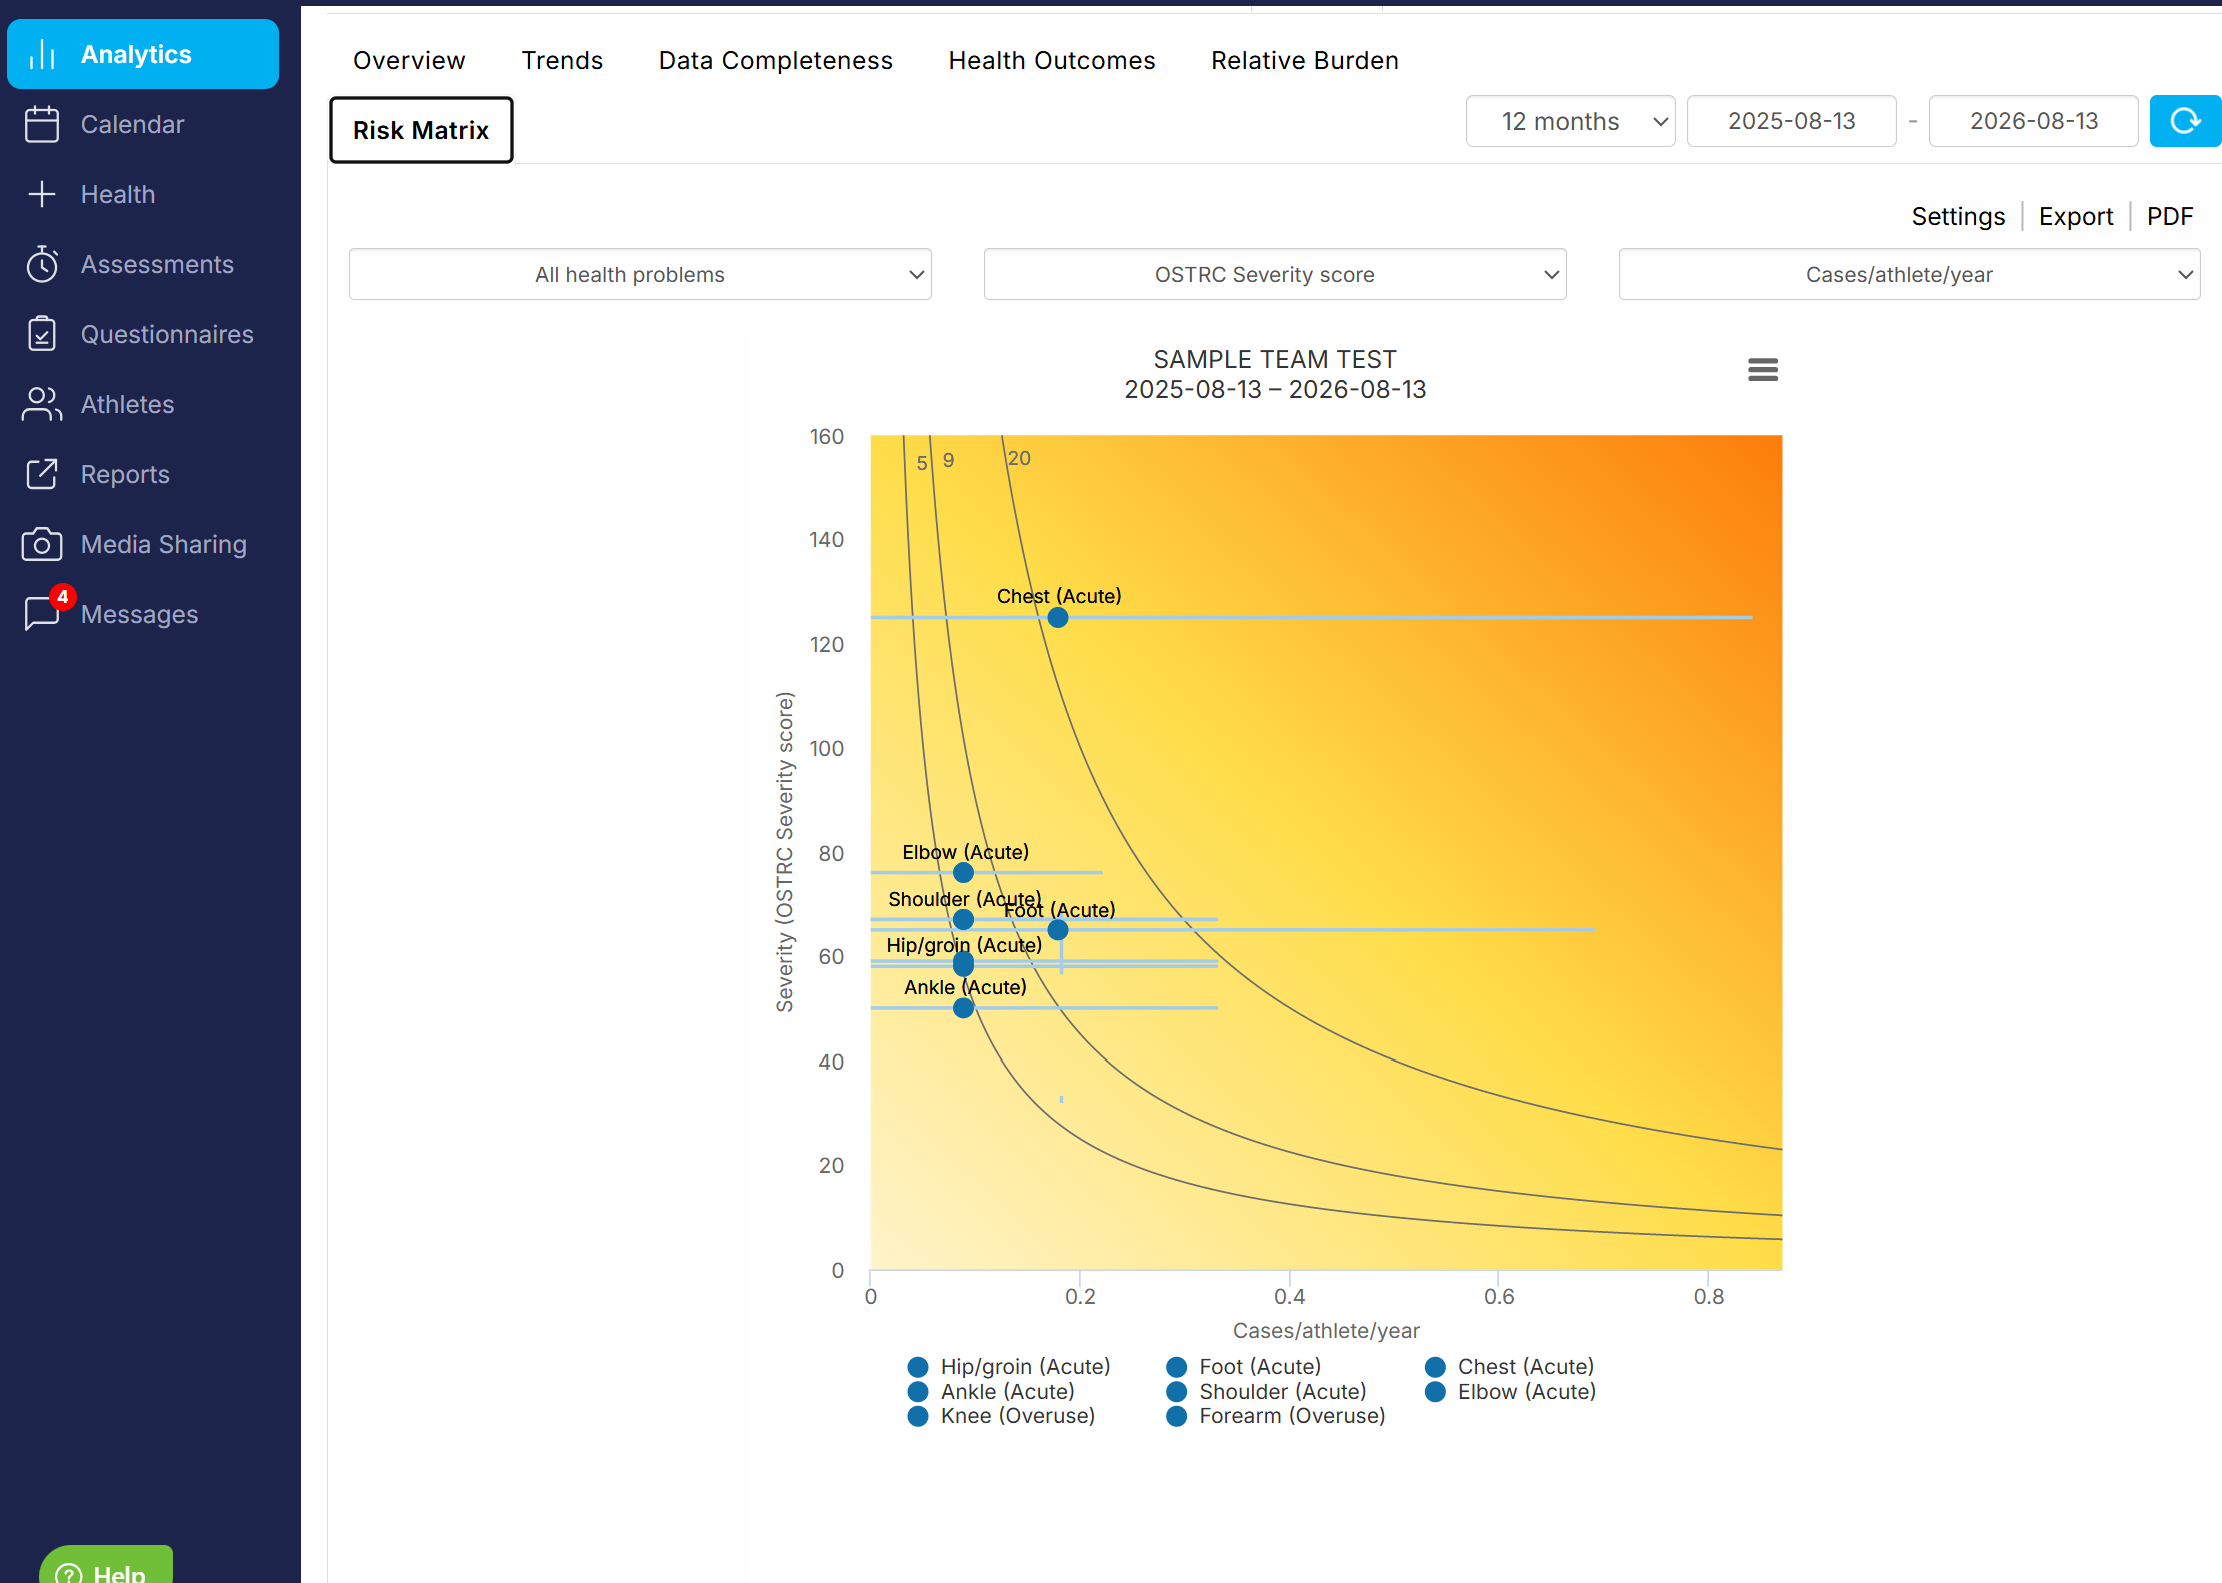
Items can be removed from the graph by clicking on their names, in the legend under the graph.
The Burden column shows the incidence x mean time loss days.
Assessments
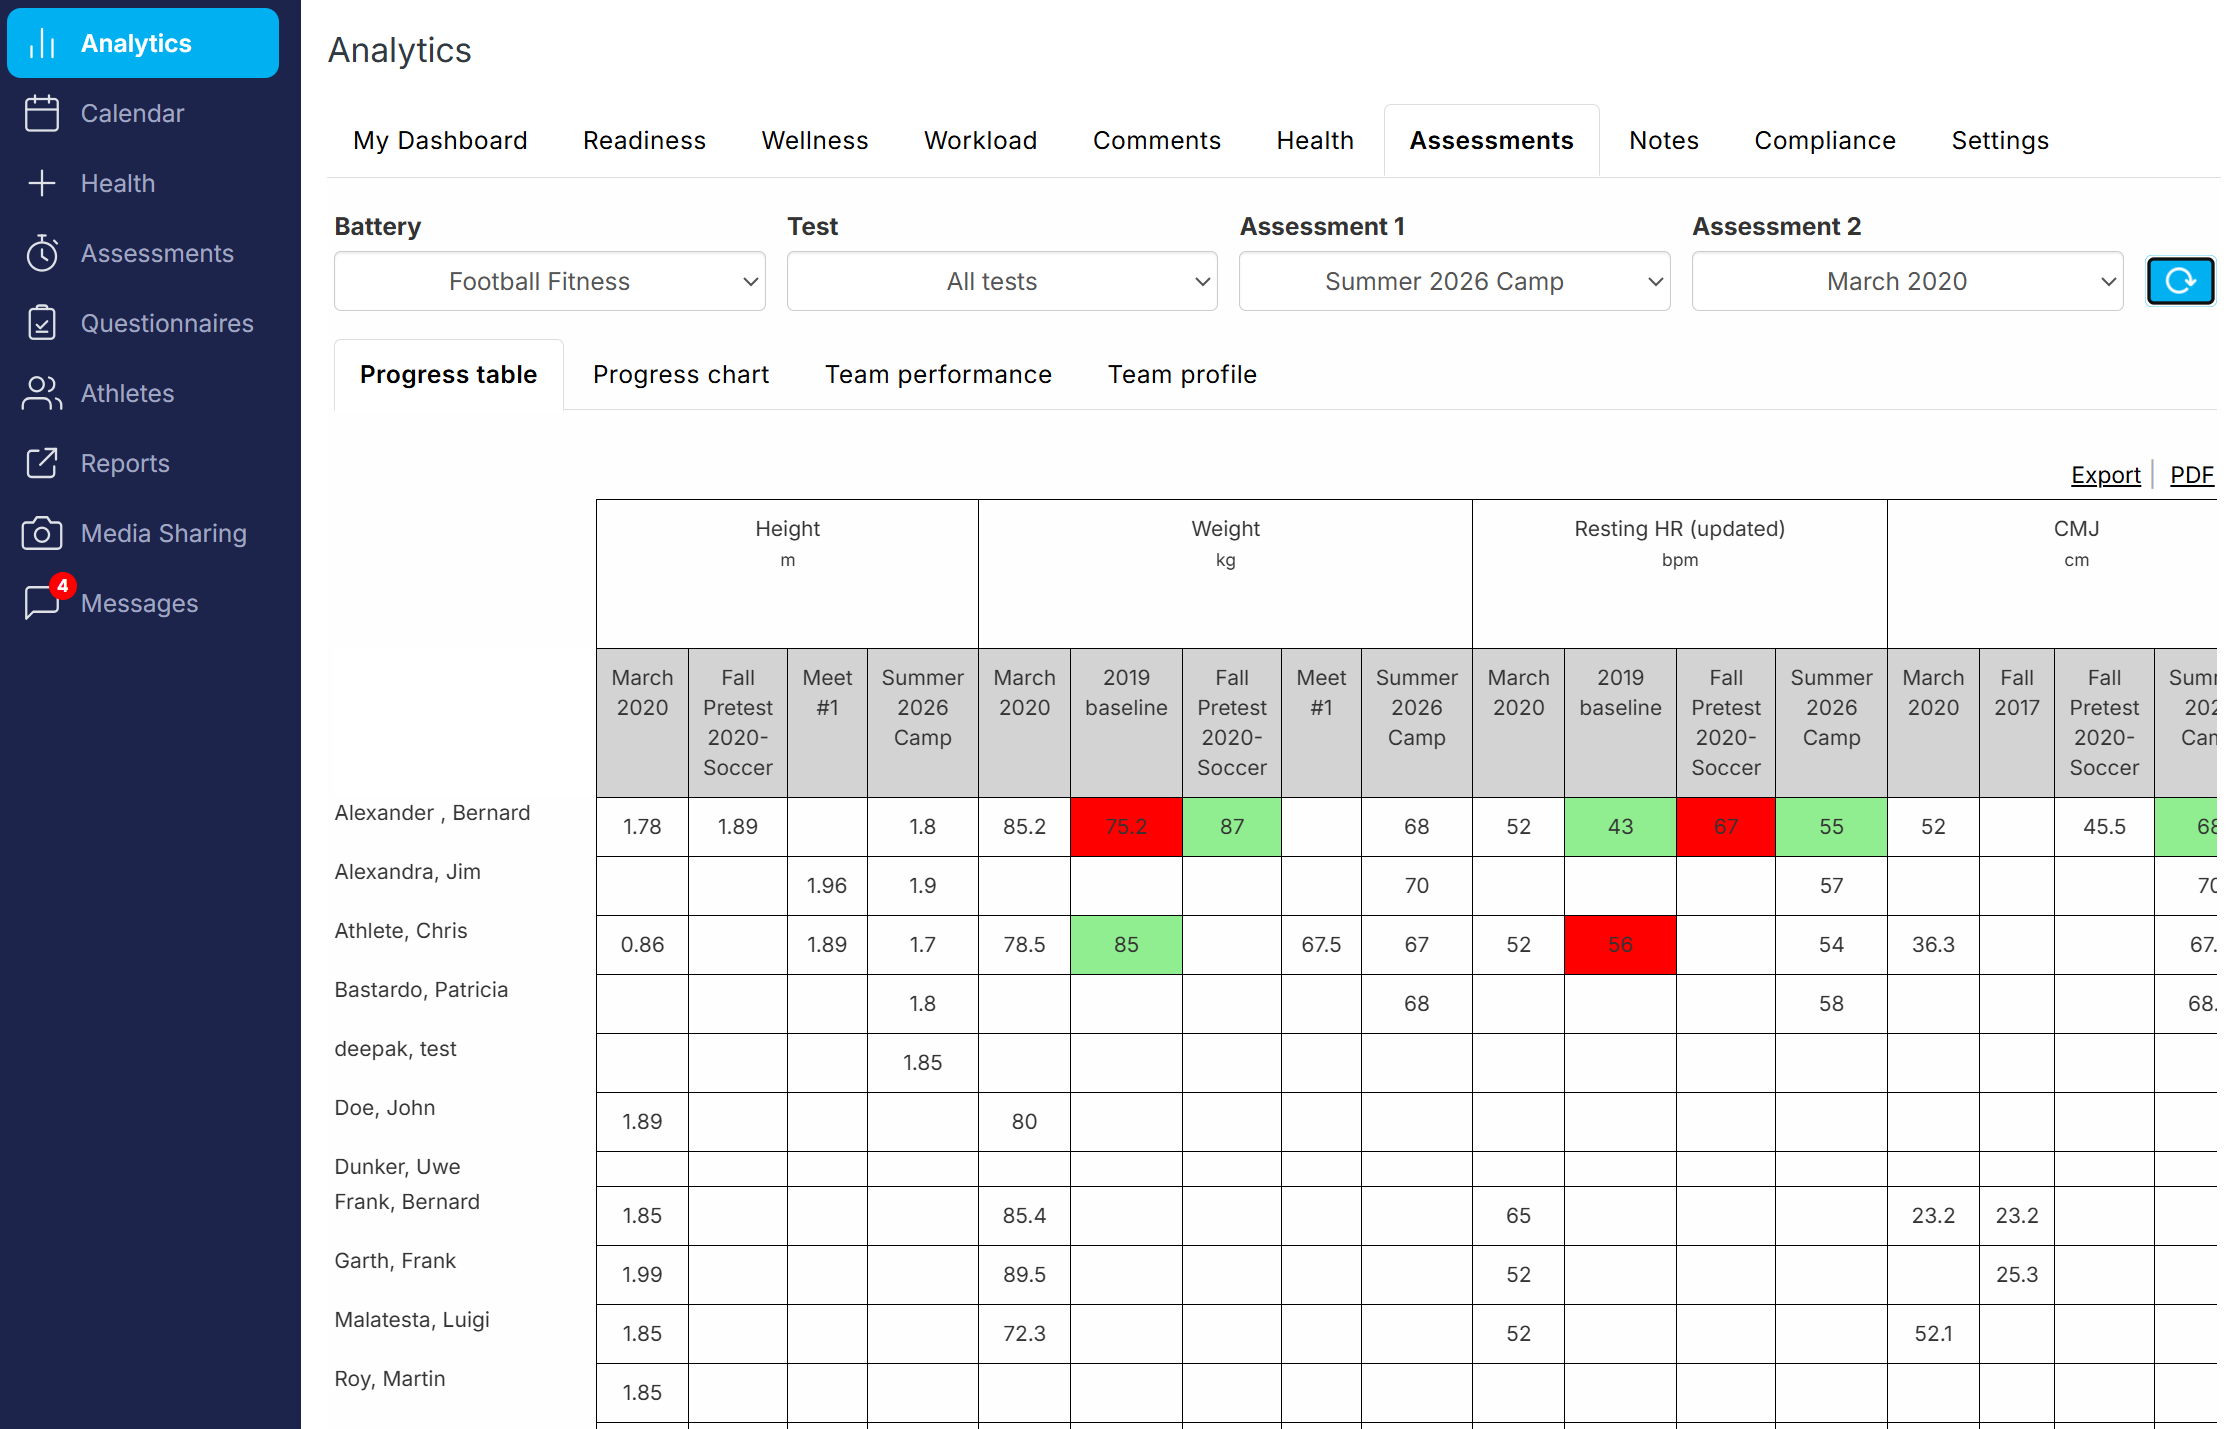
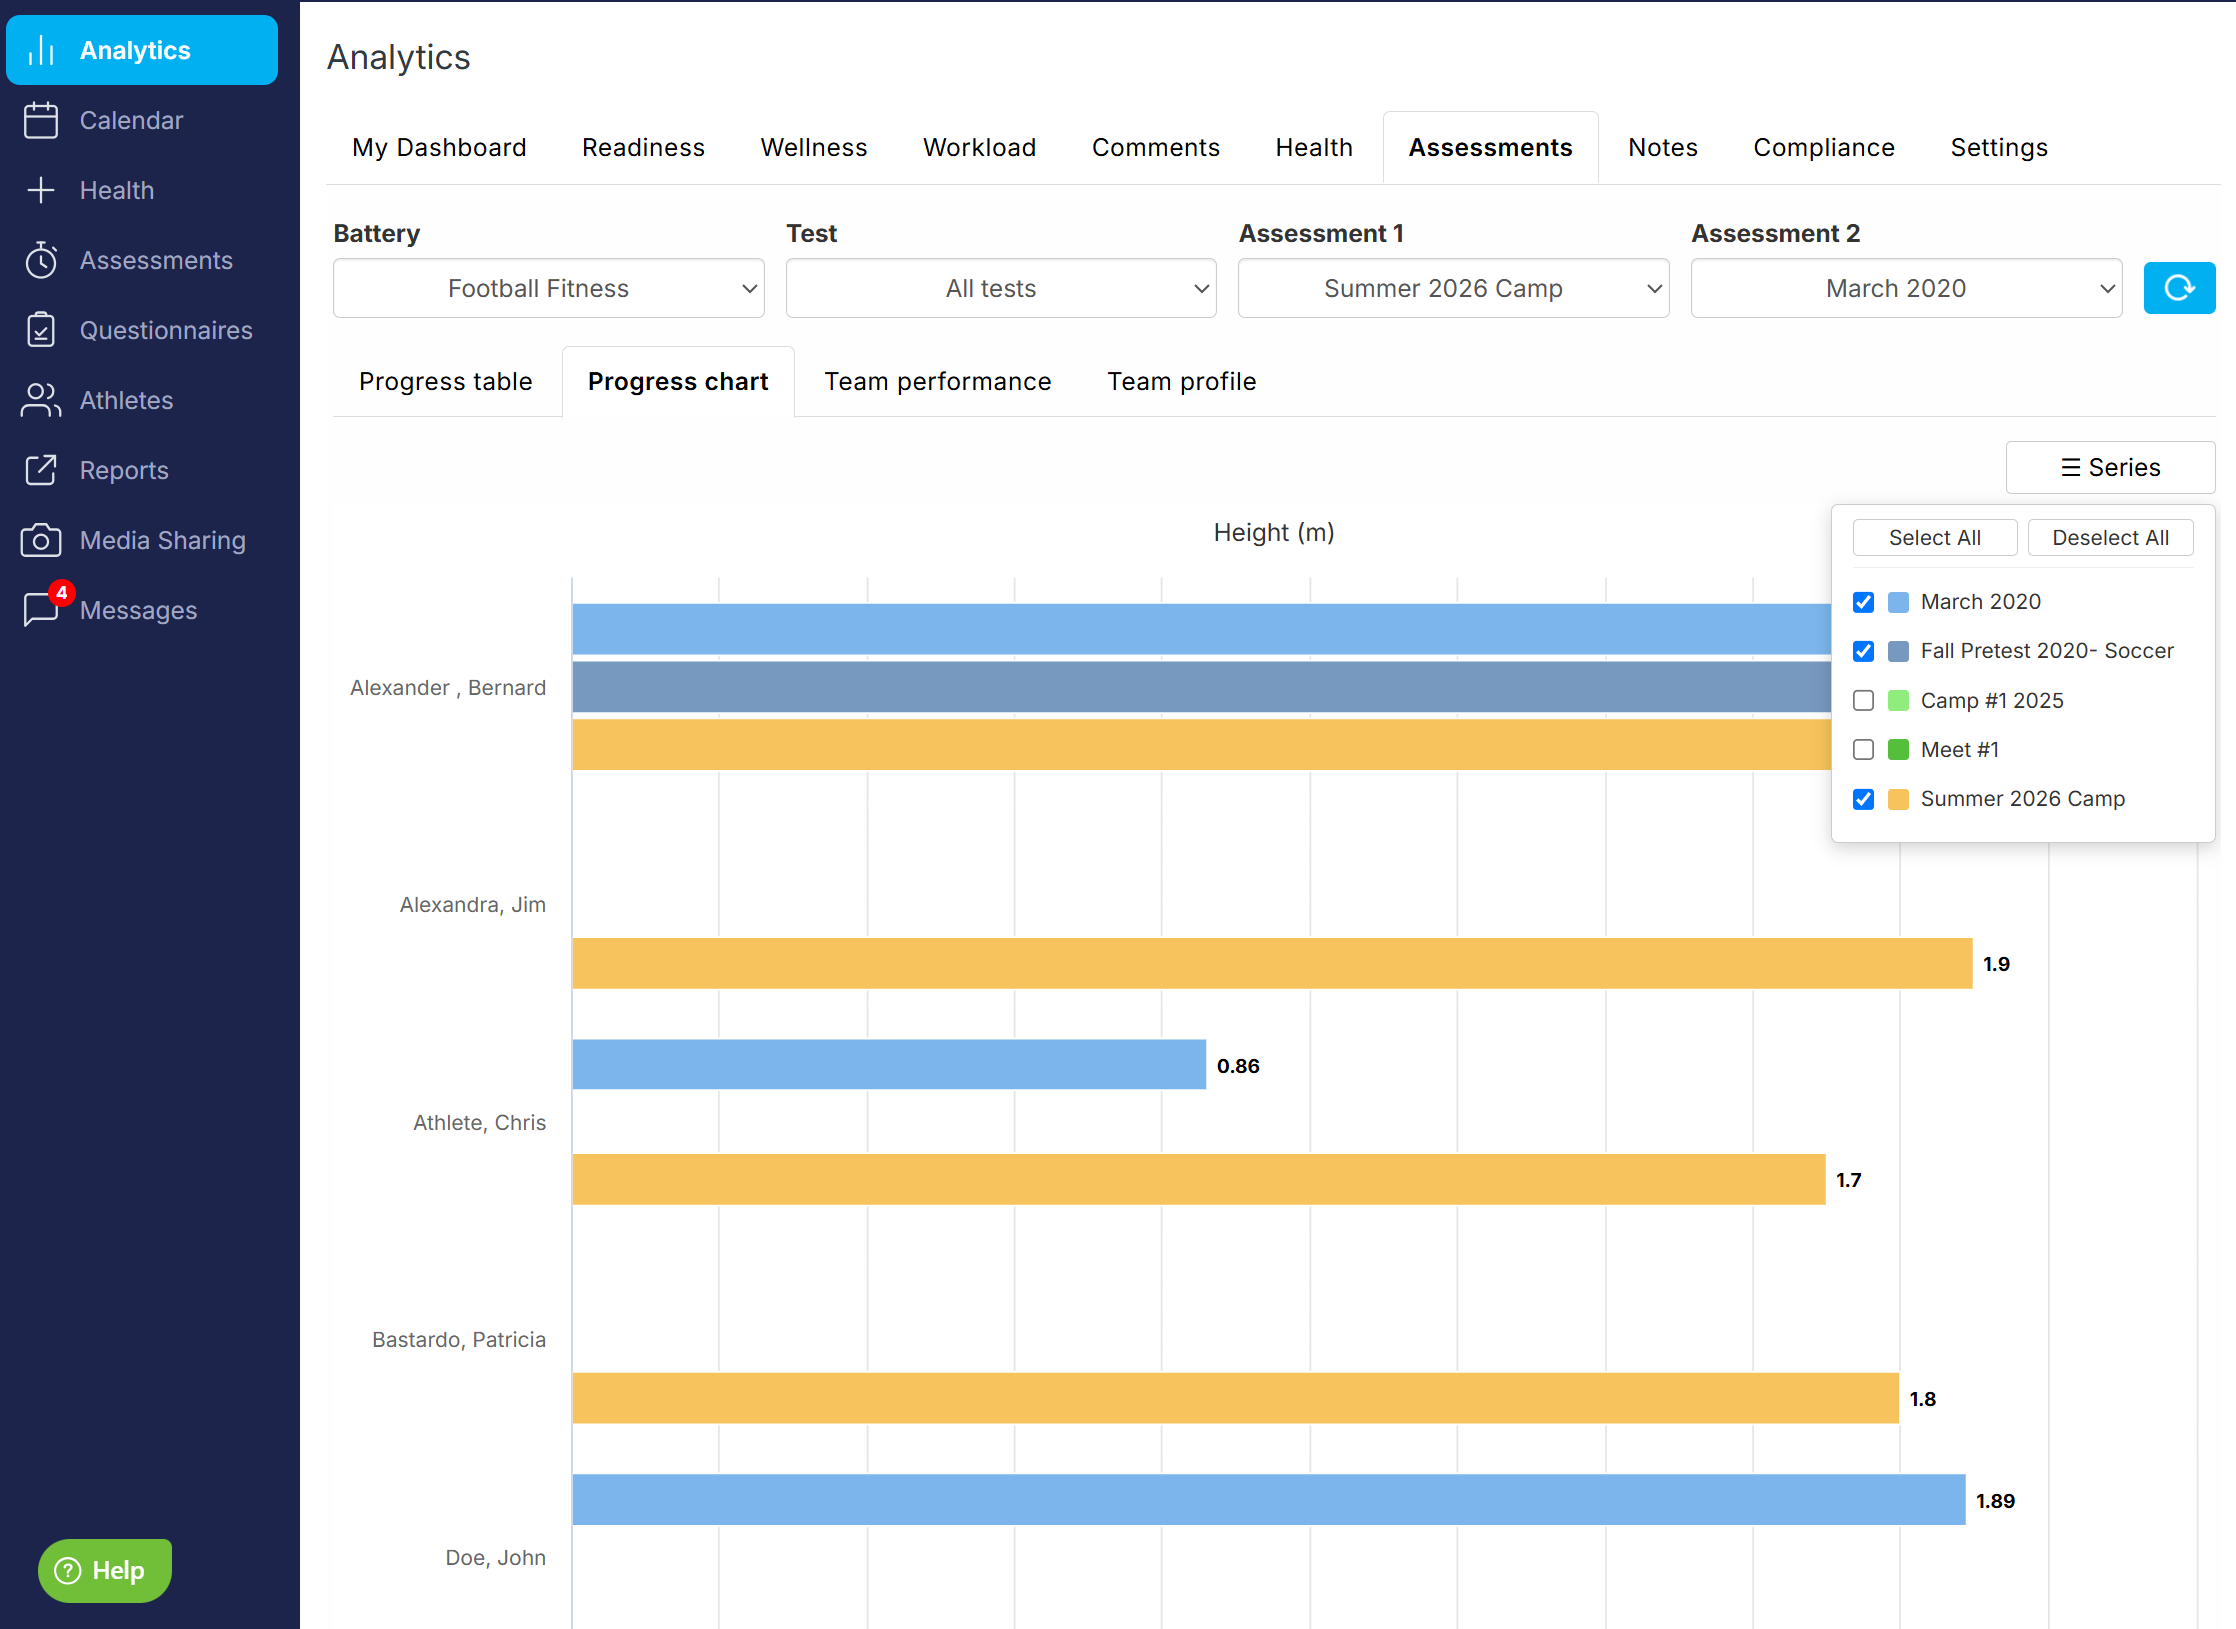
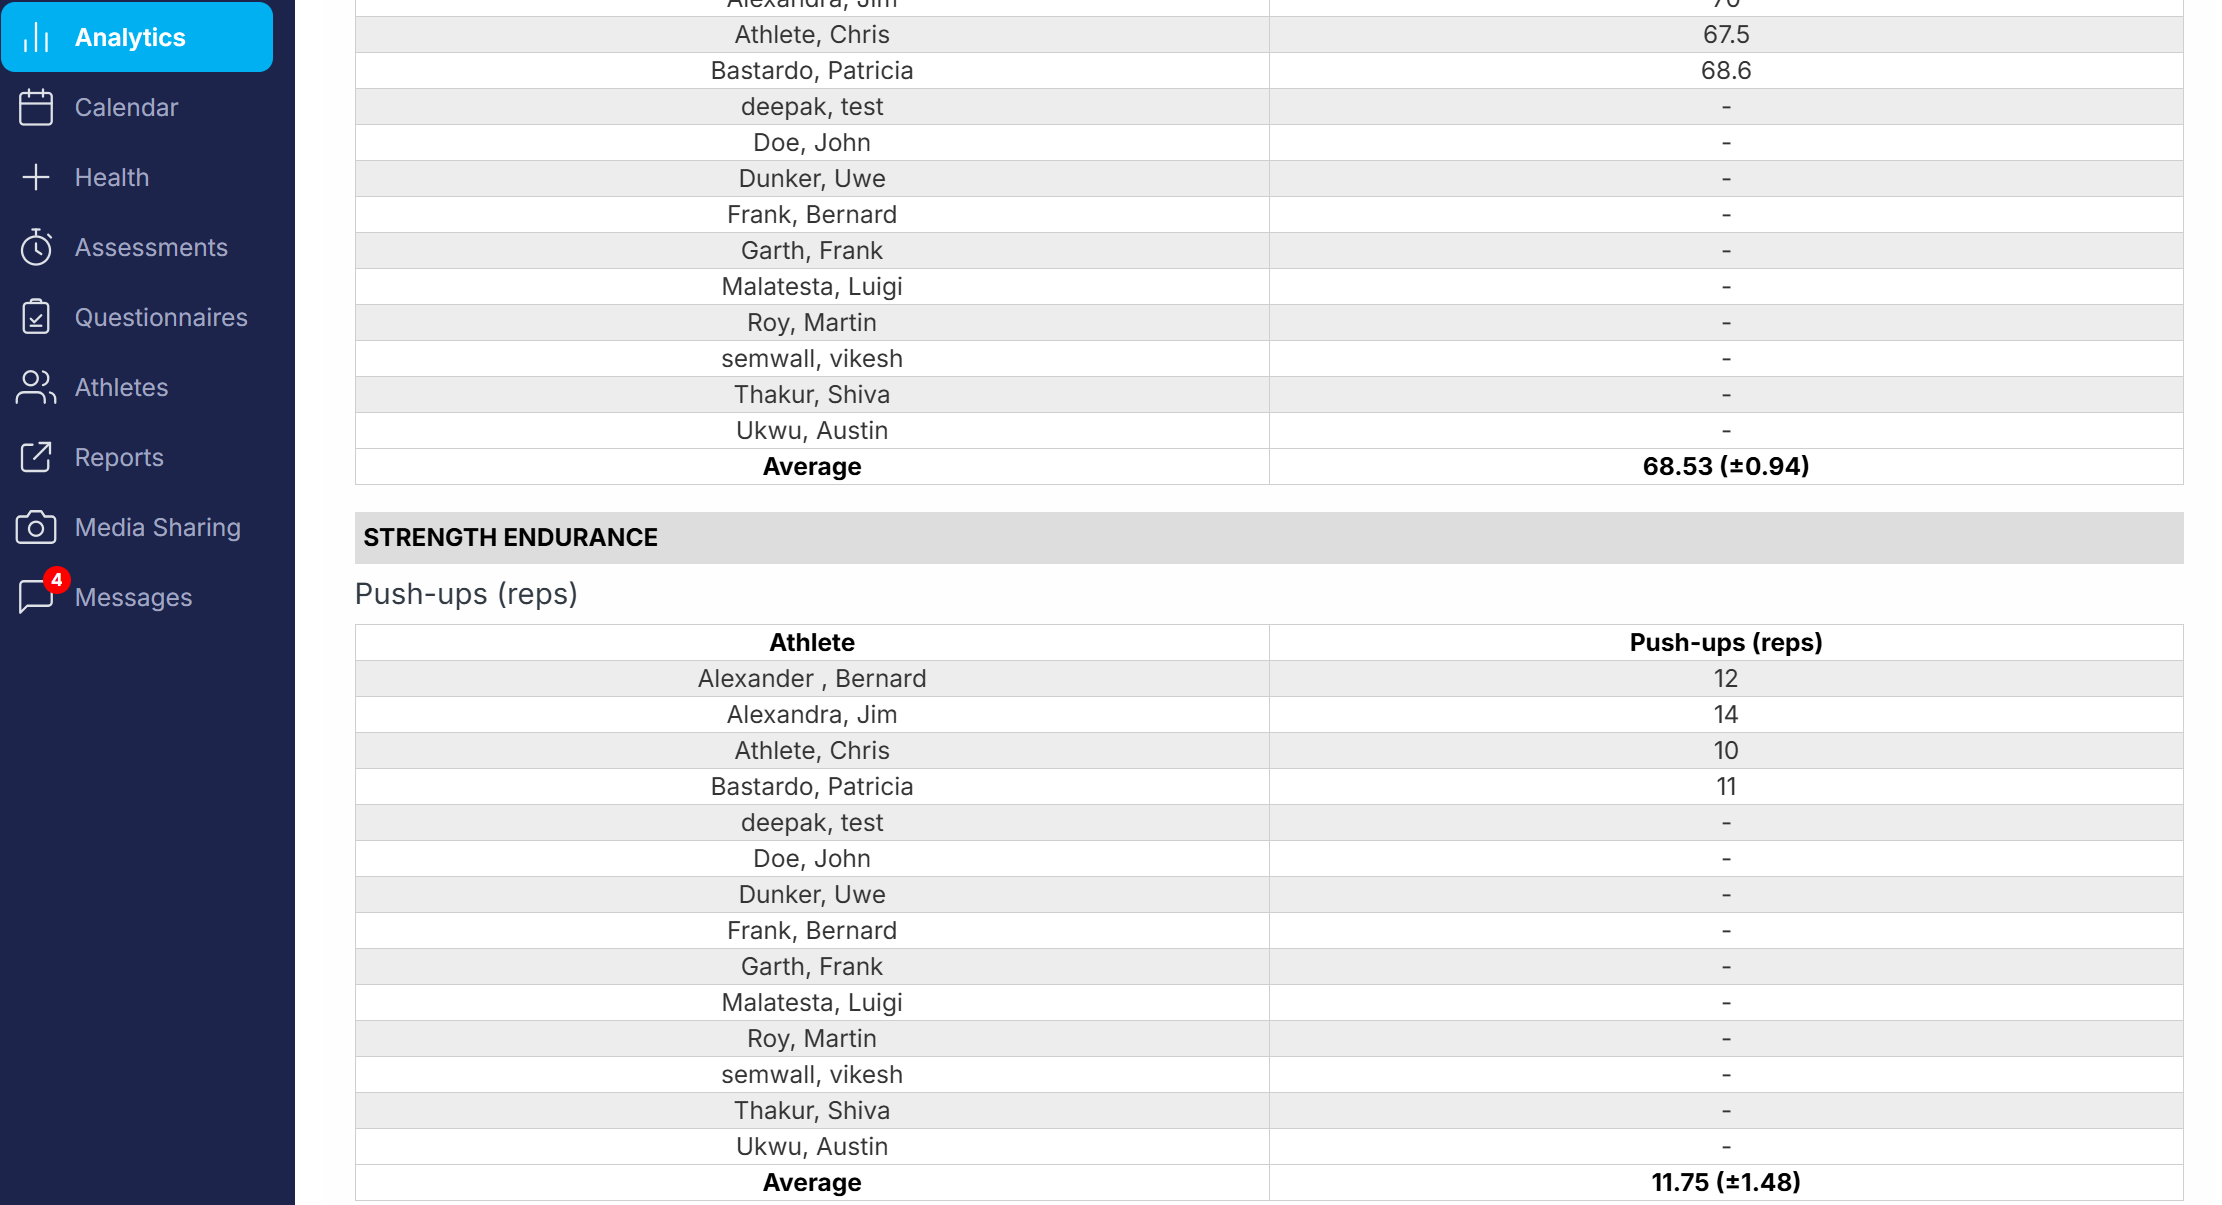
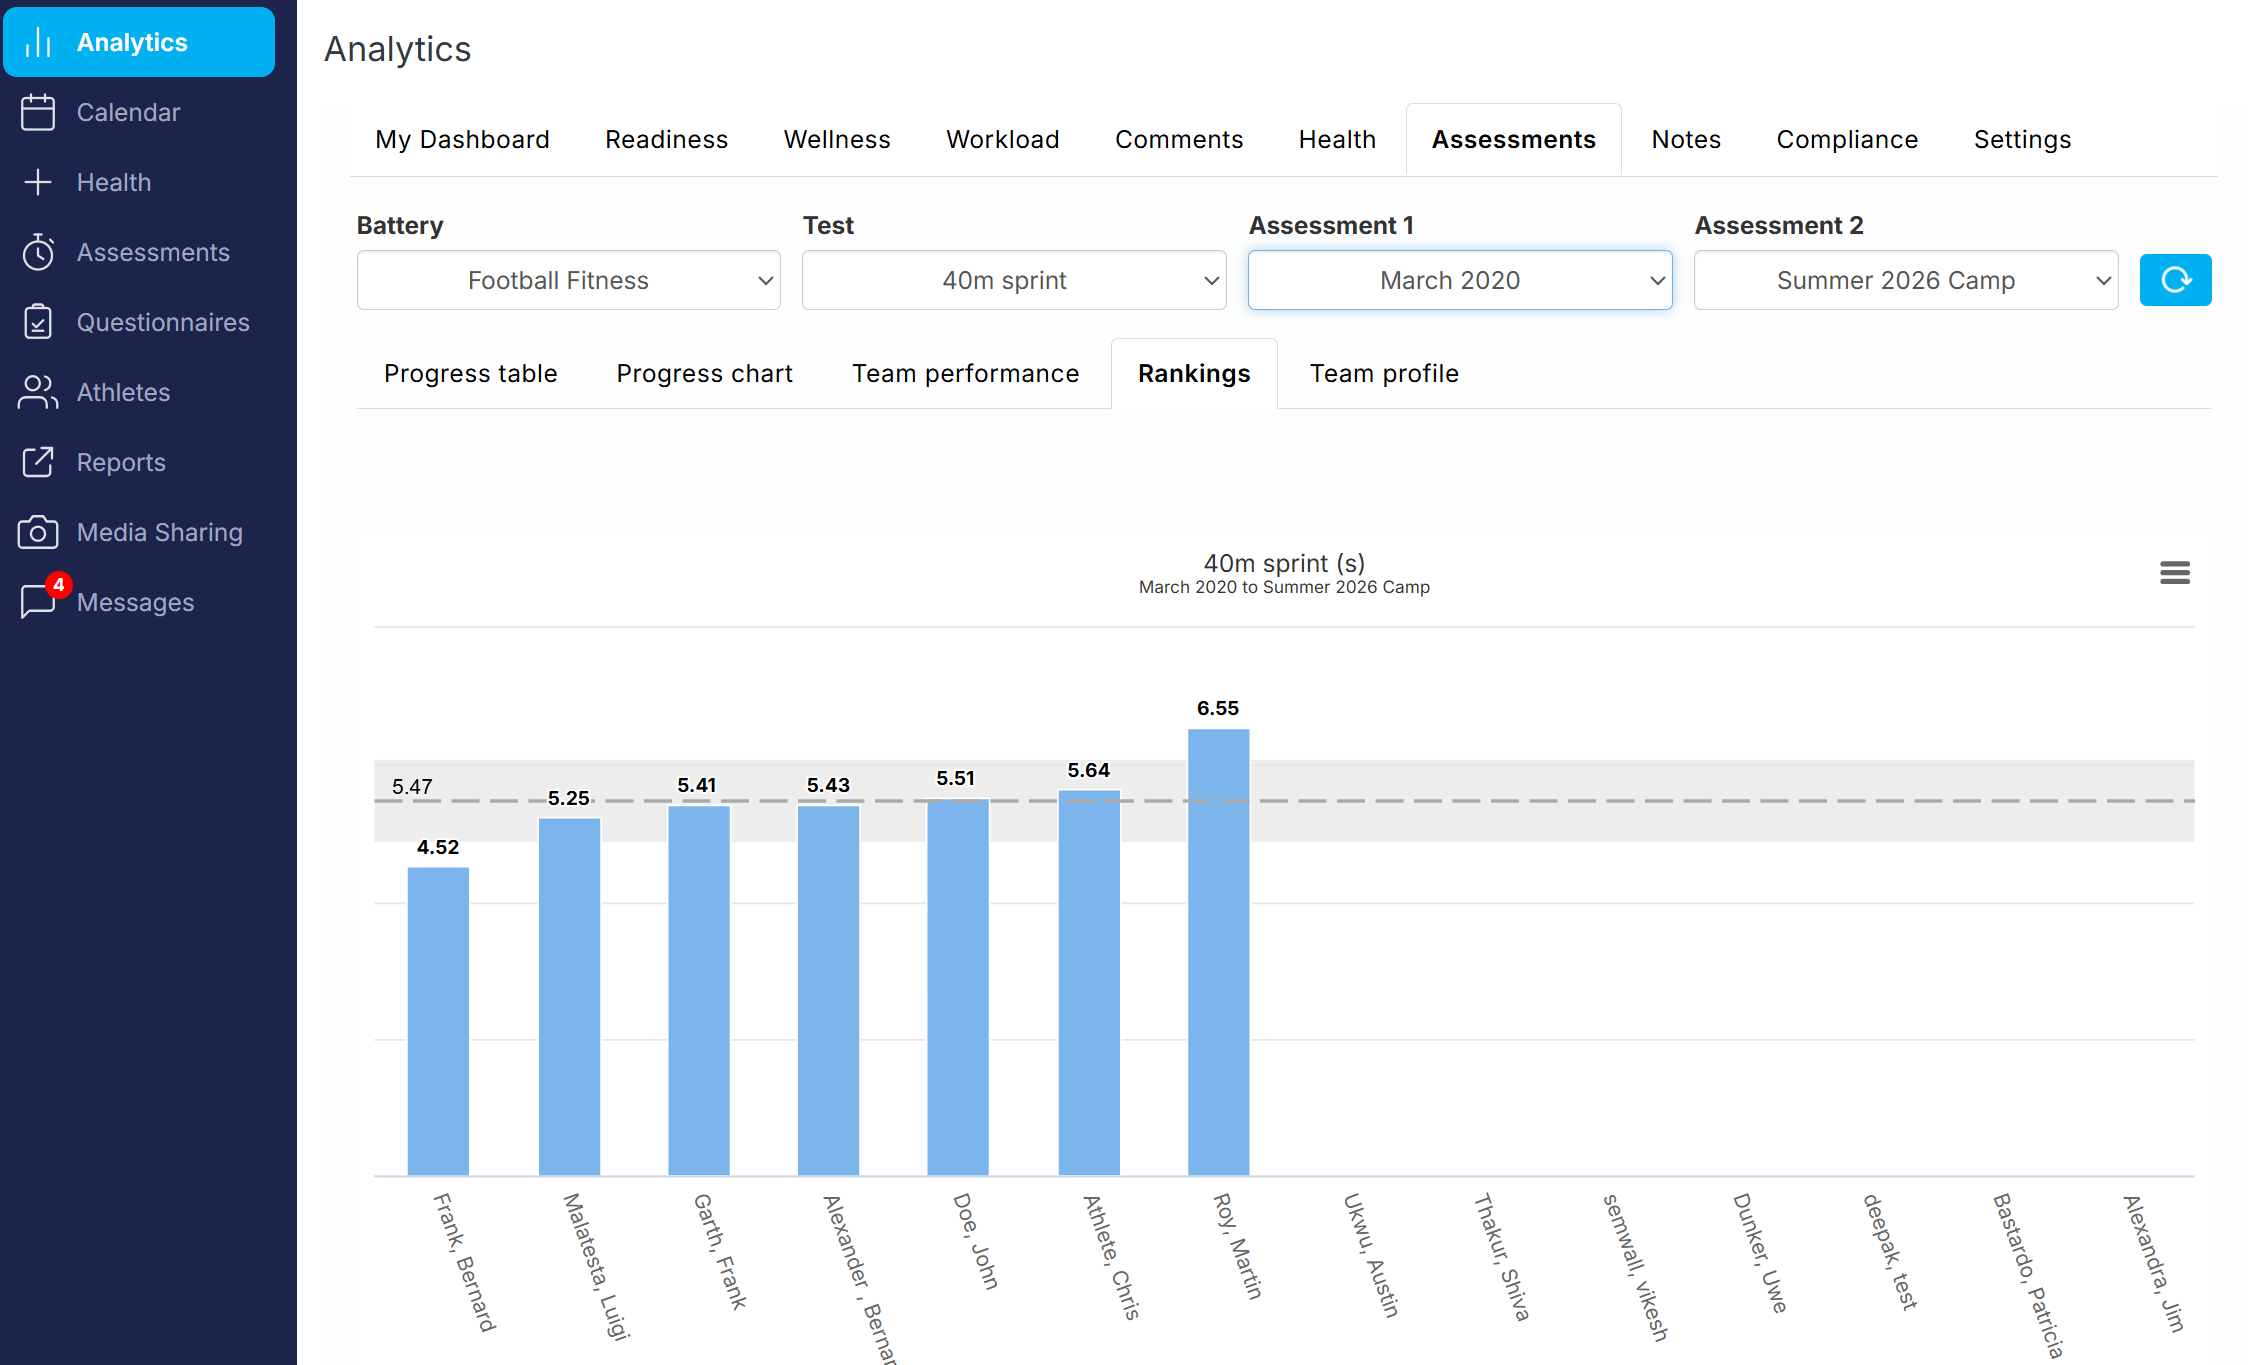
This section offers a quick group assessment and performance reporting tool. It includes the following reports:
Progress table
Progress charts
Team performance report
Ranking
Notes
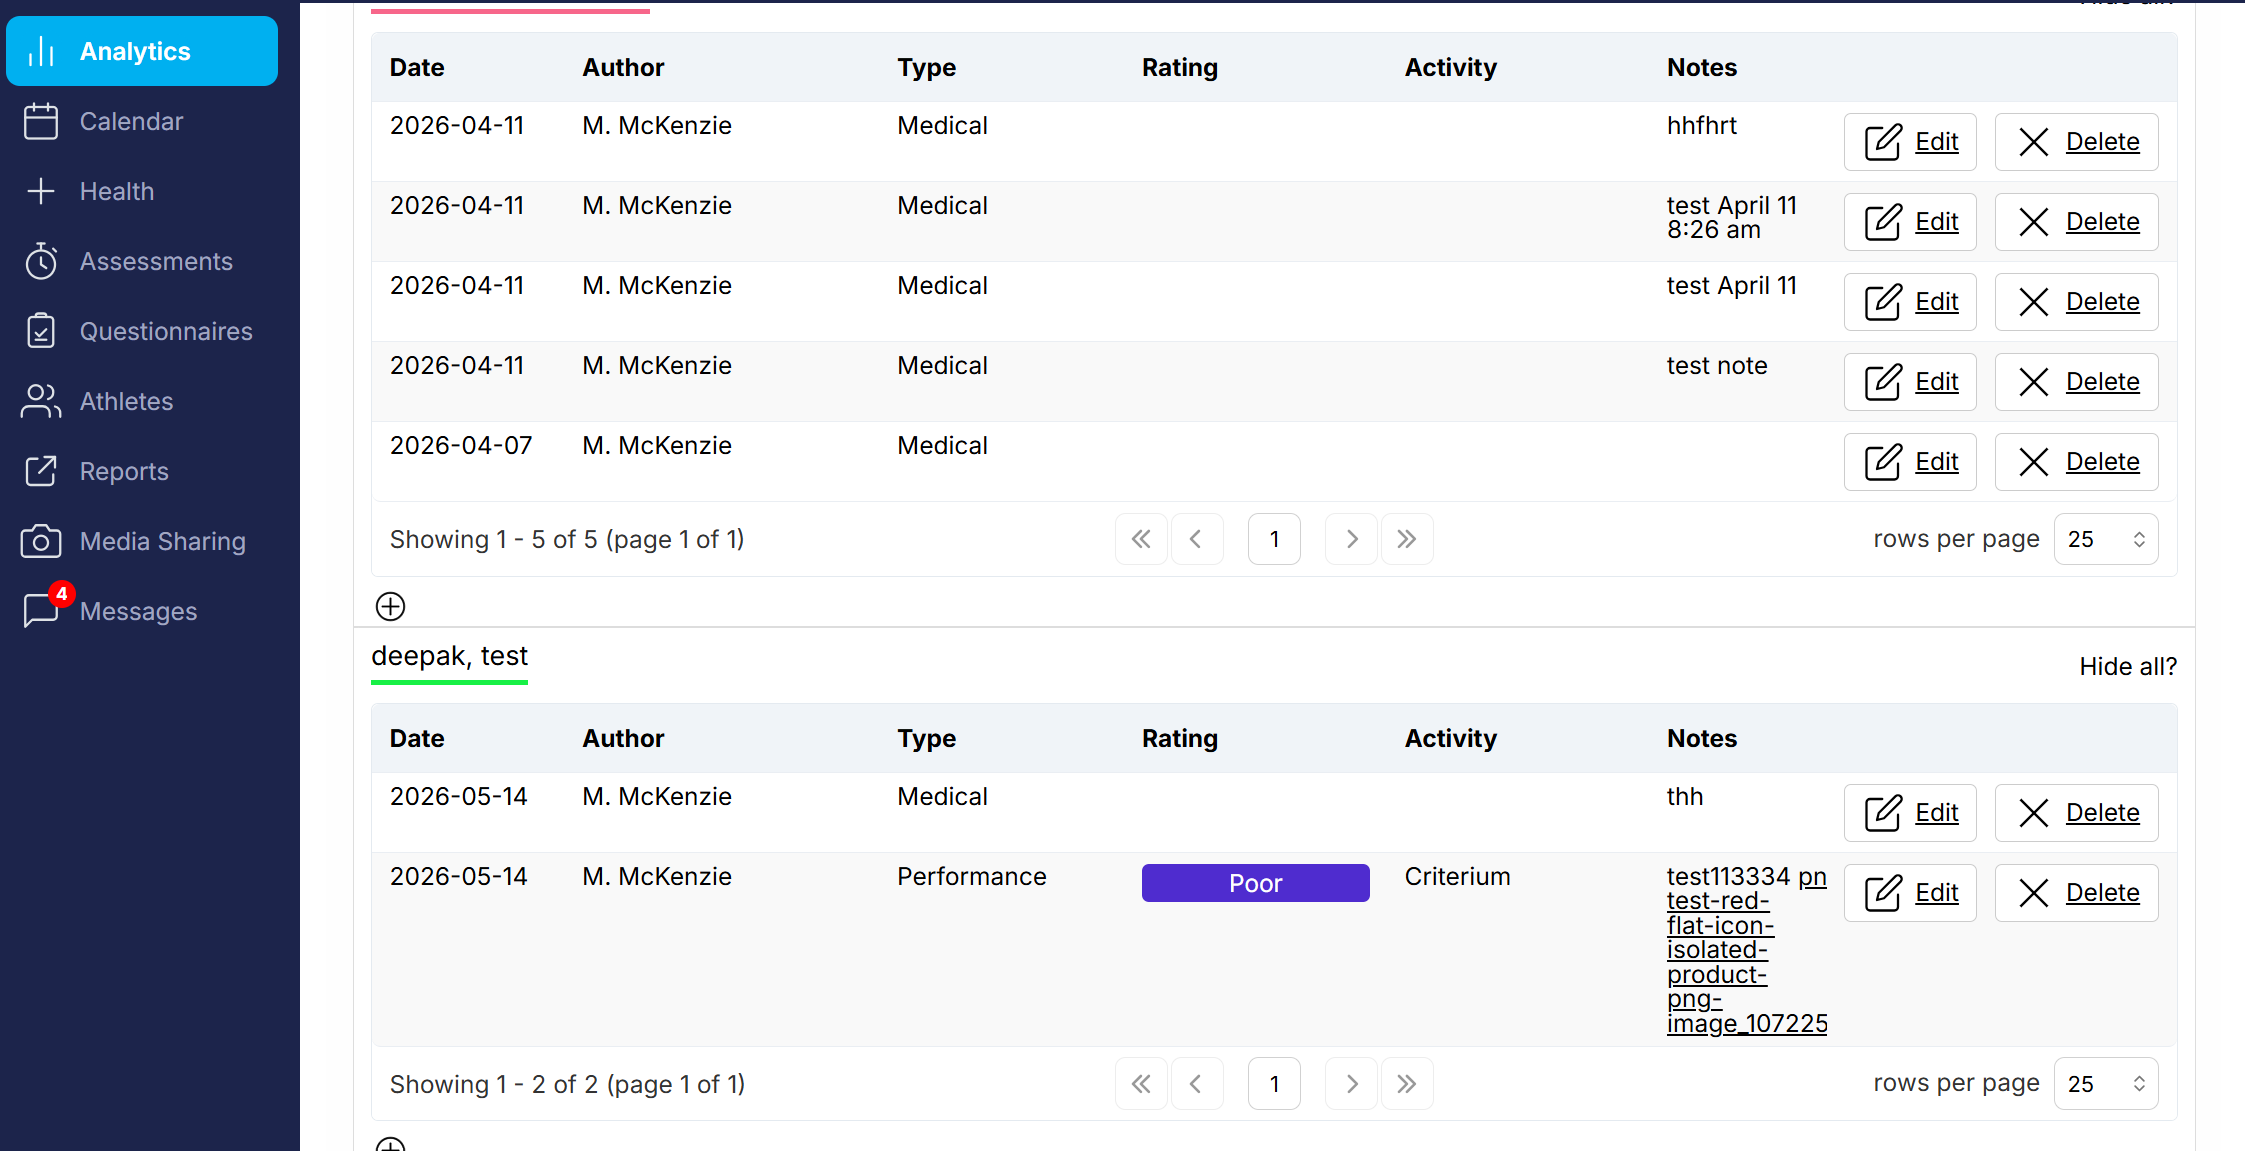
This section displays all the notes recorded by athletes, coaches and health practitioners. All columns can be sorted and filtered.
Compliance
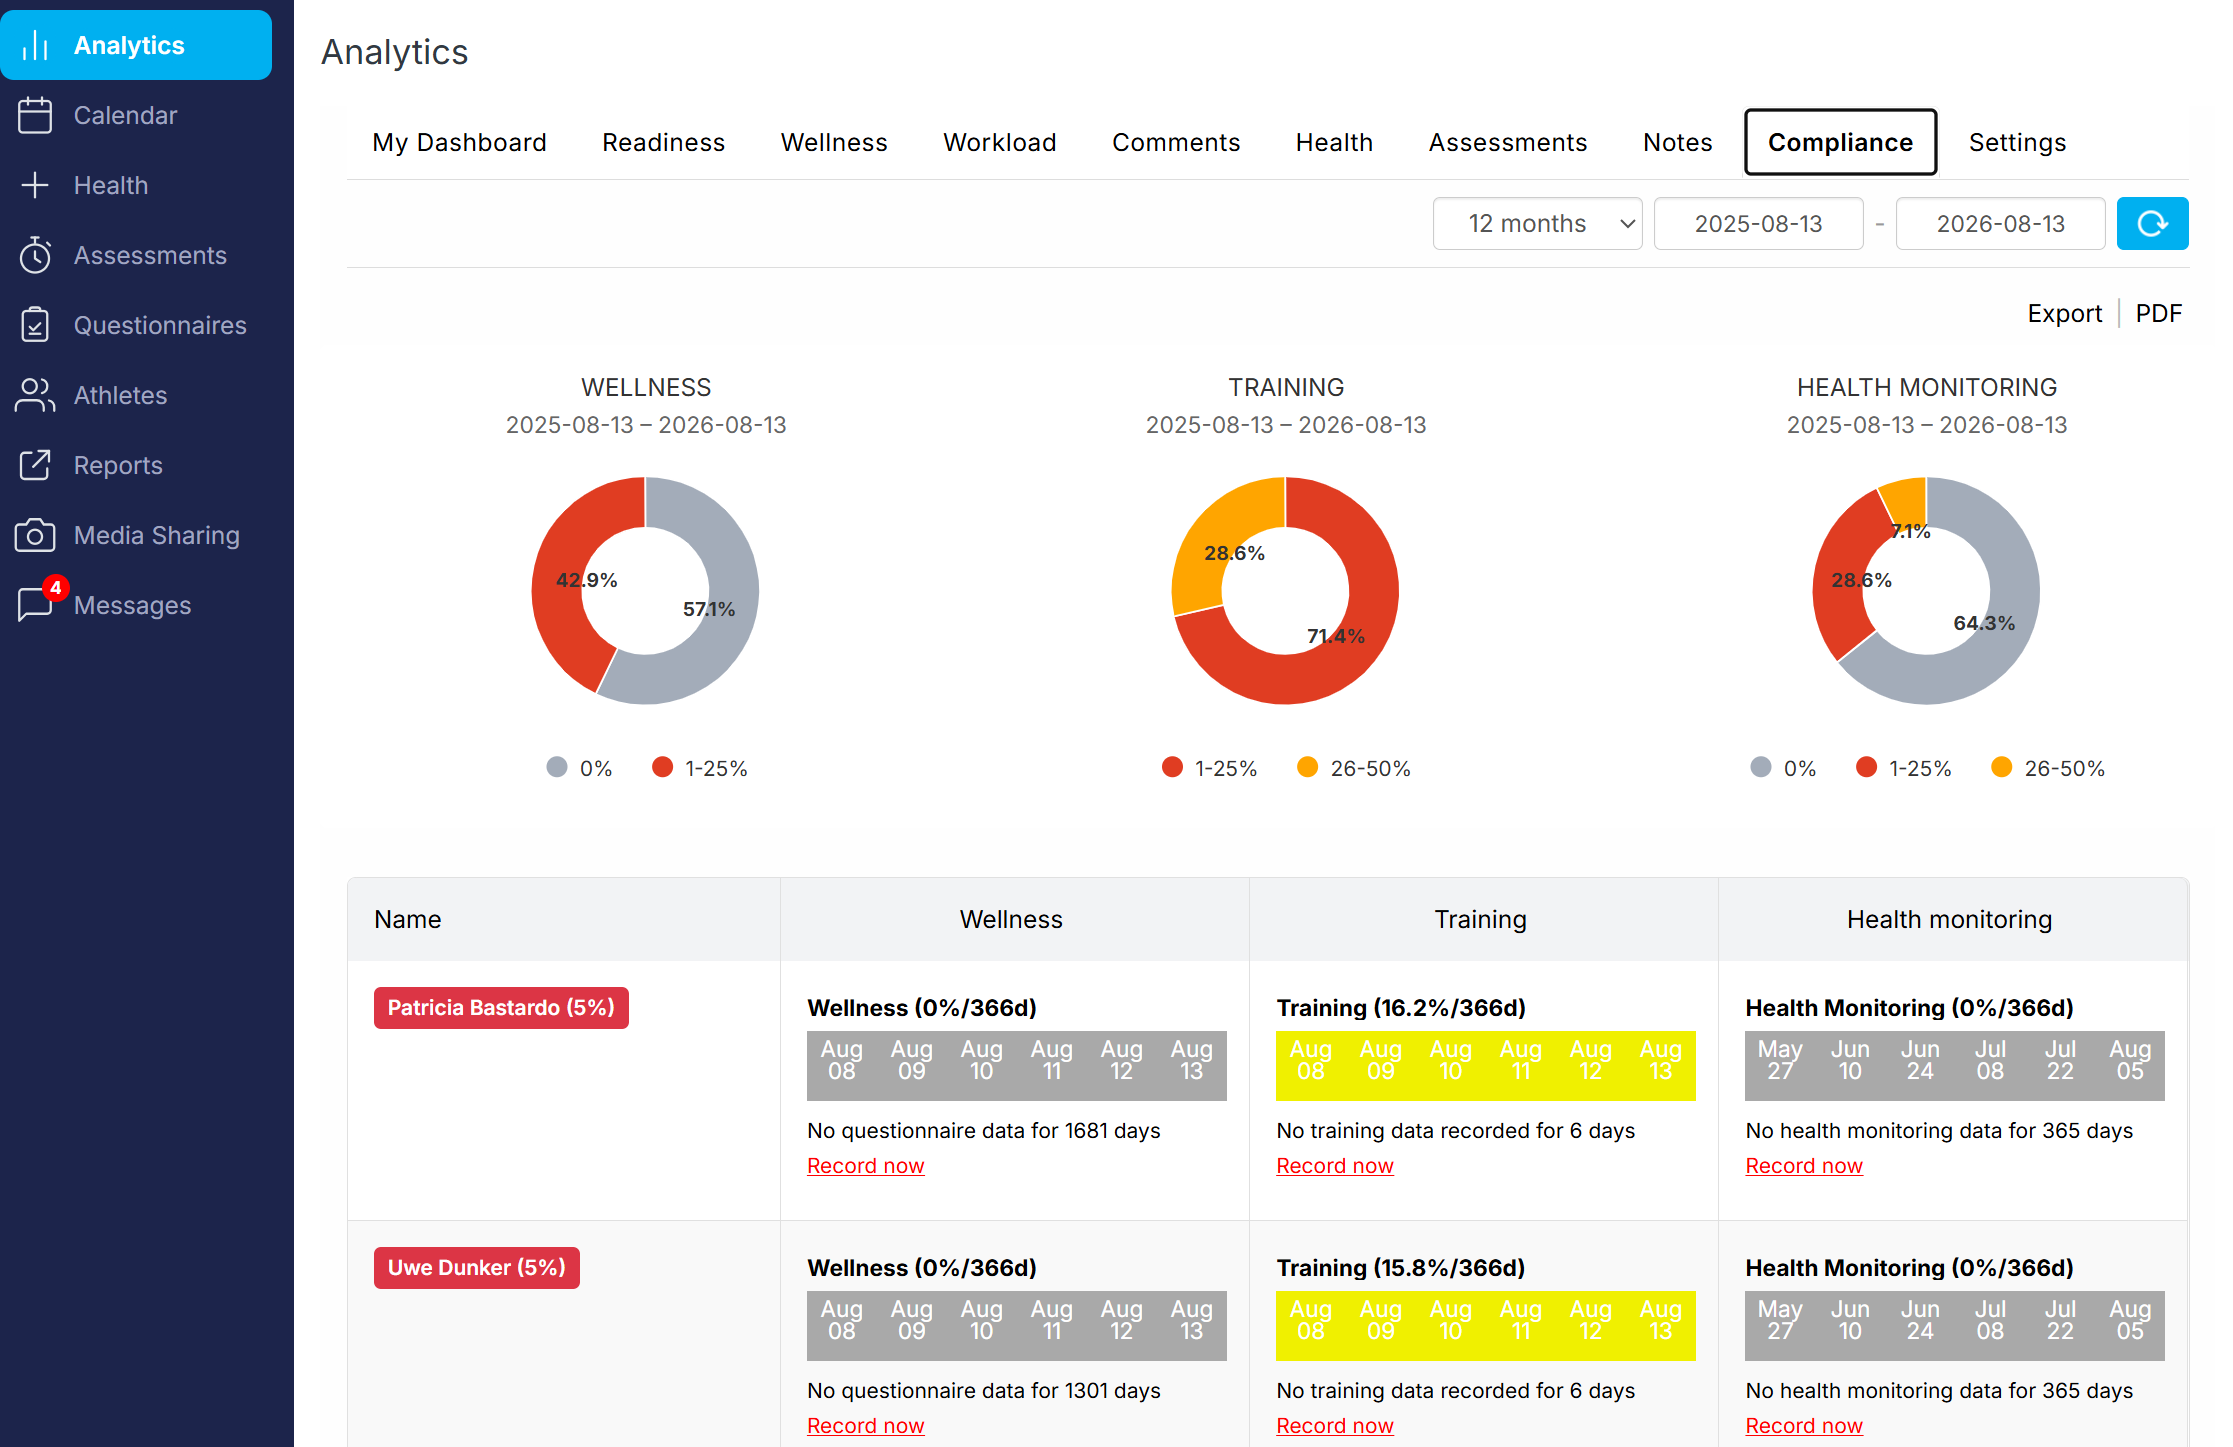
This section displays all the notes recorded by athletes, coaches and health practitioners. All columns can be sorted and filtered. Click on the Record now link to record data on the behalf of athletes.
Settings
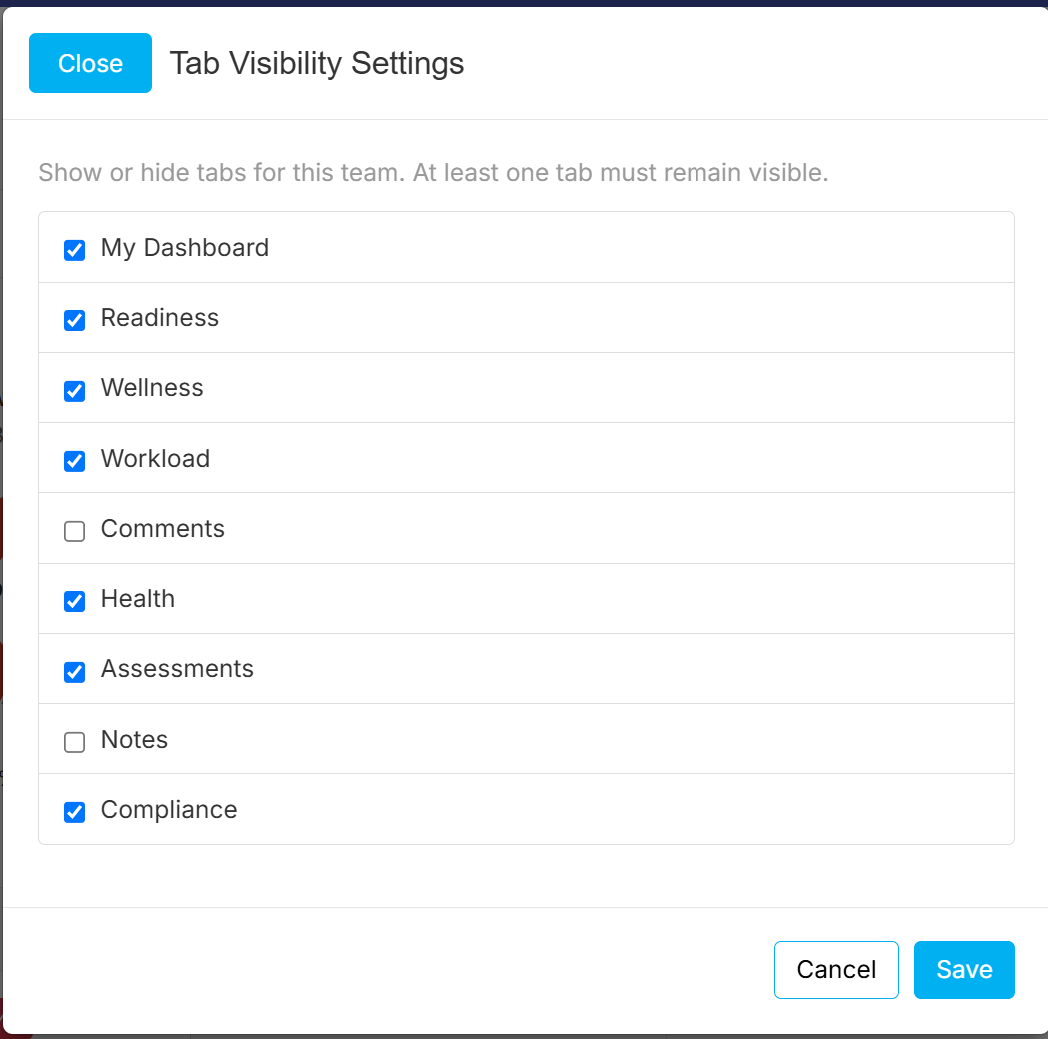
This option allows you to show and hide the various tabs of the Analytics section.